Introduction
iTOL is an online tool for the display, annotation and management of phylogenetic and other trees. Use the help sections below and different video tutorials to familiarize yourself with its functionality and various options. A typical workflow would entail:
- Uploading your tree, either anonymously or into your iTOL account
- Exploring iTOL's user interface and visualization functions
- Adding annotations to your tree (colors, styles or various datasets)
- Exporting the tree figures
Advanced users looking to automate their iTOL workflows can use the batch upload and export interfaces.
If you encounter any problems with the tree or dataset display, or have trouble understanding iTOL's functions, please contact us.
Tree upload
To upload a tree anonymously, click the Upload link in the header of any iTOL page. If you have an iTOL account, and are logged in, the upload link will be replaced with My trees. Click it to open your account page and upload a tree into one of your projects. More information about iTOL accounts and tree management is available below.
Trees should be in plain text files, and in one of supported formats (Newick, Nexus, PhyloXML or Jplace). When uploading Jplace files, make sure that the file extension is .jplace, or the format will not be recognised correctly.
Support for NHX and MrBayes metadata
iTOL can parse various metadata from MrBayes and NHX trees. All metadata values will be extracted, and available for visualization through the 'Bootstrap/metadata' section in the advanced controls tab. In addition, NHX tag name can be used to specify internal node IDs (see examples below).
Support for QIIME 2 QZA trees
iTOL supports direct upload of QZA trees generated by QIIME 2. After the initial upload, these trees can be further annotated using other QZA files. Simply drop a QZA file onto the tree display, or upload it through the button in the "Datasets" tab of the control panel.
The following QZA types are supported:
- FeatureData[Taxonomy] (e.g. taxonomy.qza): Leaf labels will be automatically assigned, and confidence values will appear as a bar chart dataset.
- FeatureTable[Frequency] (e.g. table.qza, table-deblur.qza): A multi value bar chart will be created with sample frequencies in different tree leaves.
- FeatureData[AlignedSequence] (e.g. aligned-rep-seqs.qza, masked-aligned-rep-seqs.qza): Multiple sequence alignment dataset will be created automatically.
Example trees in Newick format:
  A tree with bootstraps and branch lengths:

   (A:0.1,(B:0.1,C:0.1)90:0.1)98:0.3);

    A, B, C  : leaf names
    0.1, 0.3 : branch lengths
    90,98    : bootstrap values


  A tree with internal node IDs:

   (A:0.1,(B:0.1,C:0.1)INT1:0.1[90])INT2:0.3[98]);

    A, B, C    : leaf names
    INT1, INT2 : internal node IDs
    0.1, 0.3   : branch lengths
    90,98      : bootstrap values


  A tree with NHX style metadata:

   (A:0.1,(B:0.2,(C:0.2,D:0.3):0.4[&&NHX:conf=0.01:name=NODE1]):0.5);

    A, B, C   : leaf names
    internal node will have the ID NODE1
    metadata value 'conf' will be available in the  'Bootstraps/metadata' section


  MrBayes tree with full metadata:

   (
        n1[&prob=1.0e+00,prob_stddev=0.0e+00,prob_range={1.0e+00,1.0e+00},
           prob(percent)="100",prob+-sd="100+-0"]:7.827820e-02[&length_mean=7.95052056e-02,
           length_median=7.82782e-02,length_95%HPD={5.417228e-02,1.09222e-01}],
        n2[&prob=1.0e+00,prob_stddev=0.0e+00,prob_range={1.0e+00,1.0e+00},
           prob(percent)="100",prob+-sd="100+-0"]:1.029146e-01[&length_mean=1.03620749e-01,
           length_median=1.029146e-01,length_95%HPD={7.64916100e-02,1.344909e-01}]
   )[&prob=1.0e+00, prob_stddev=0.0e+00,prob_range={1.0e+00,1.0e+00},
        prob(percent)="100",prob+-sd="100+-0"]:1.905703e-01[&length_mean=1.91679099e-01,
        length_median=1.905703e-01,length_95%HPD={1.37001000e-01,2.535305e-01}];

     n1, n2: leaf names
     prob, prob_stddev, prob(percent) ... : various metadata fields which can be used in the
                                           'Bootstraps/metadata' section
Video tutorial iTOL user account and tree management
Managing your trees in the iTOL account
Creating an account in iTOL gives you the possibility to easily organize your trees and have an overview of their features, datasets and saved views. Trees are grouped into different projects, and these projects can be arranged into different workspaces.
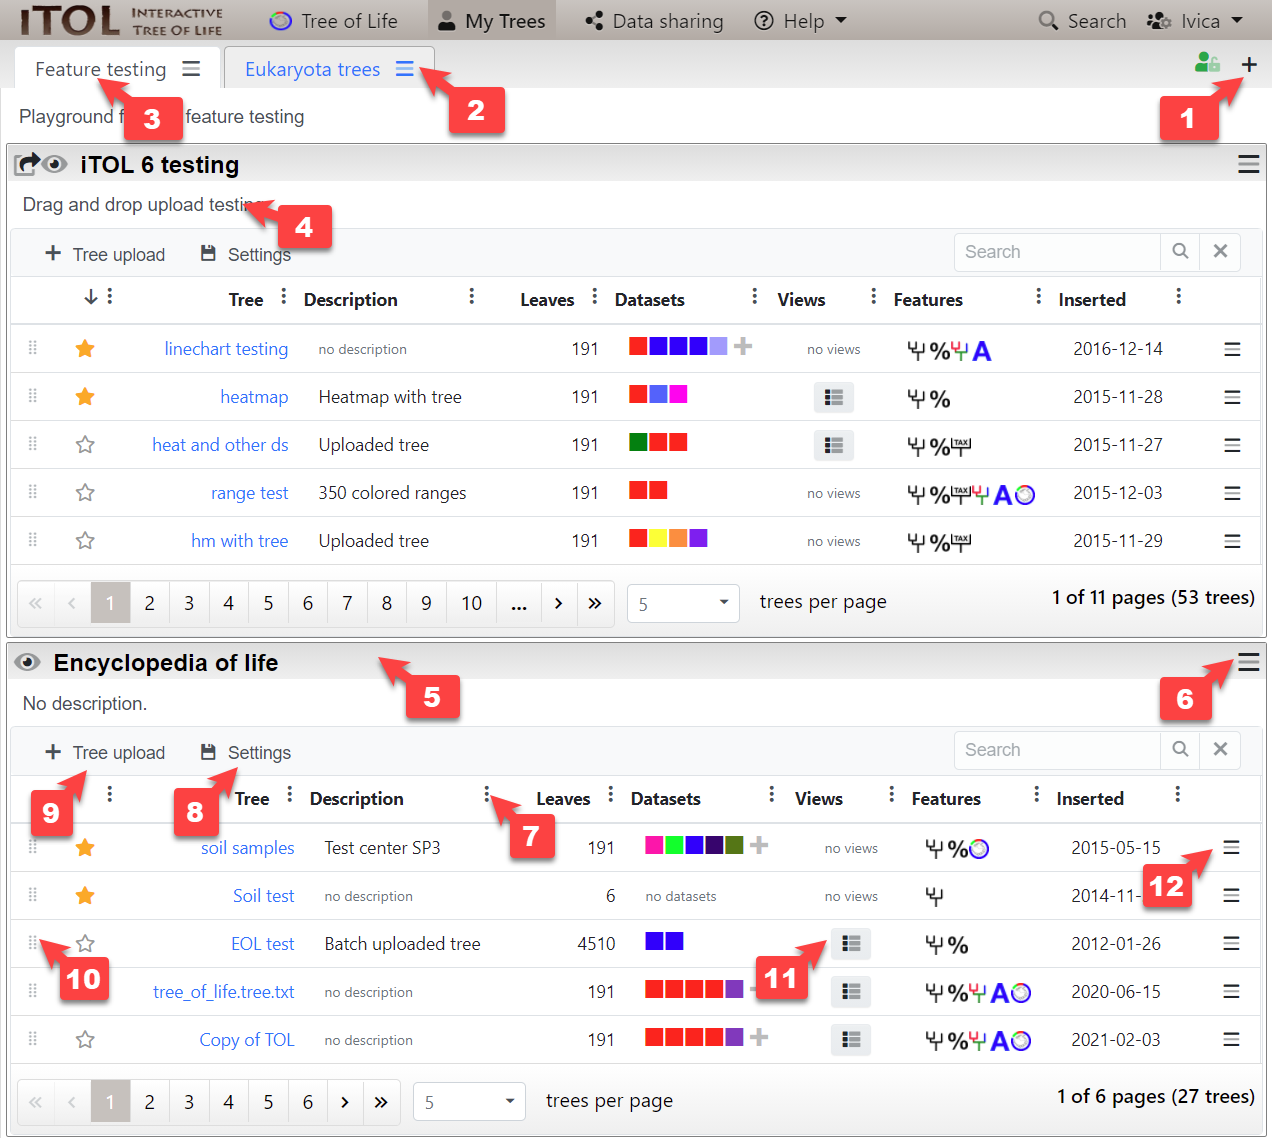
Overview of the different account functions (click the image to enlarge):
- Create a workspace by clicking the plus icon () in the top right
- Create a project, or edit / delete the workspace through the functions menu ()
- Click the workspace tab label and drag it to rearrange the workspace order
- Click the workspace or project descriptions to edit them
- Click and drag the project title bar to rearrange the project order. Double-click the title bar to collapse or expand the project.
- Move a project to a different workspace through the project function menu (). You can also change the sharing options there.
- Use the column options menu to change the sort order and select which columns should be visible. Click and drag the column headers to rearrange them.
- Save the project display settings (sort order, column visibility and order and page size), either for a single project, or for your whole account (all projects).
- Upload one or more trees to the project. You can also paste the tree text into the provided box.
- Click and drag to rearrange the trees, or move them to a different project.
- If your tree has any saved views, you can restore them directly through this menu
- Tree options menu can be used to rename the trees, duplicate or delete them
Video tutorial Viewer user interface
iTOL viewer user interface
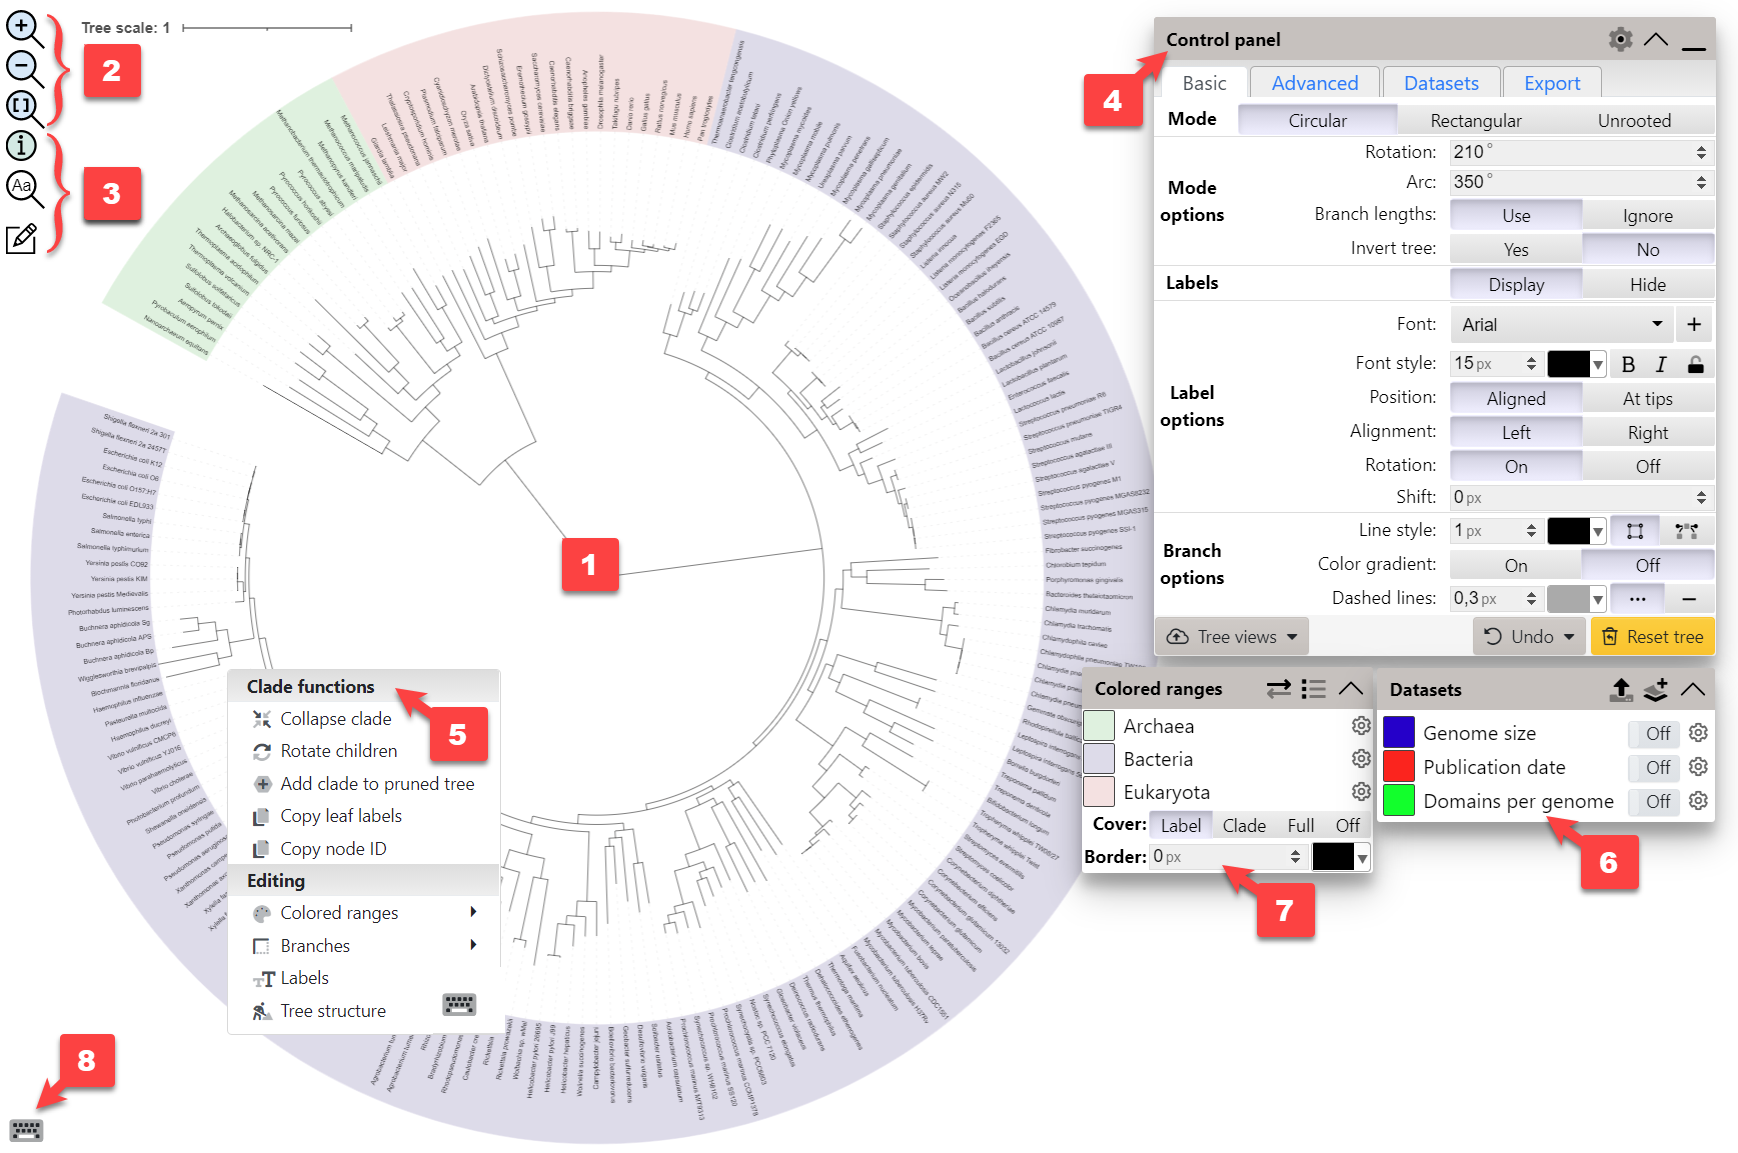
An overview of the main parts of iTOL's tree viewer user interface (click the image to enlarge):
- Main tree display: Change the zoom level with your mouse wheel. To move/pan the tree, simply click and drag with your mouse. You can also use the mouse wheel to pan the tree. Keep the Shift key pressed while scrolling the wheel to pan horizontally, or the Ctrl key to pan vertically. If you simultaneously keep the Alt / meta pressed, the panning speed will increase.
- Zoom controls: In addition to the mouse wheel, zoom icons can be used to change the tree zoom level. Clicking the
 icon will fit the tree to the current window.
 - Other functions: Hover over the
 to display basic information about the current tree.
  icon can be used to quickly find a specific tree node. Click the
  icon to open the Manual annotation tool box.
 - Main control panel: The majority of iTOL's controls and functions are available here, split over 4 tabs: Basic, Advanced, Datasets and Export.
- Node functions menu: Click on any tree branch or leaf label to display the available functions and interactive annotation / editing options.
- Datasets legend box: If any datasets are present in the tree, they will be listed here. You can toggle the display of individual datasets, access their options by clicking the icon, or delete them by hovering over the colored box and clicking the icon.
- Legacy colored ranges legend box: If any legacy colored ranges are present in the tree, these will be listed here. You can toggle the range display modes, access their options by clicking the icon, or delete them by hovering over the colored box and clicking the icon.
- Keyboard shortcuts help: Hover over this icon to display the currently defined keyboard shortcuts
Click the icon in the control panel header to set the default position of various user interface panels, toggle the display of various user interface help hints and tree hover popups.
Video tutorial Viewer functions
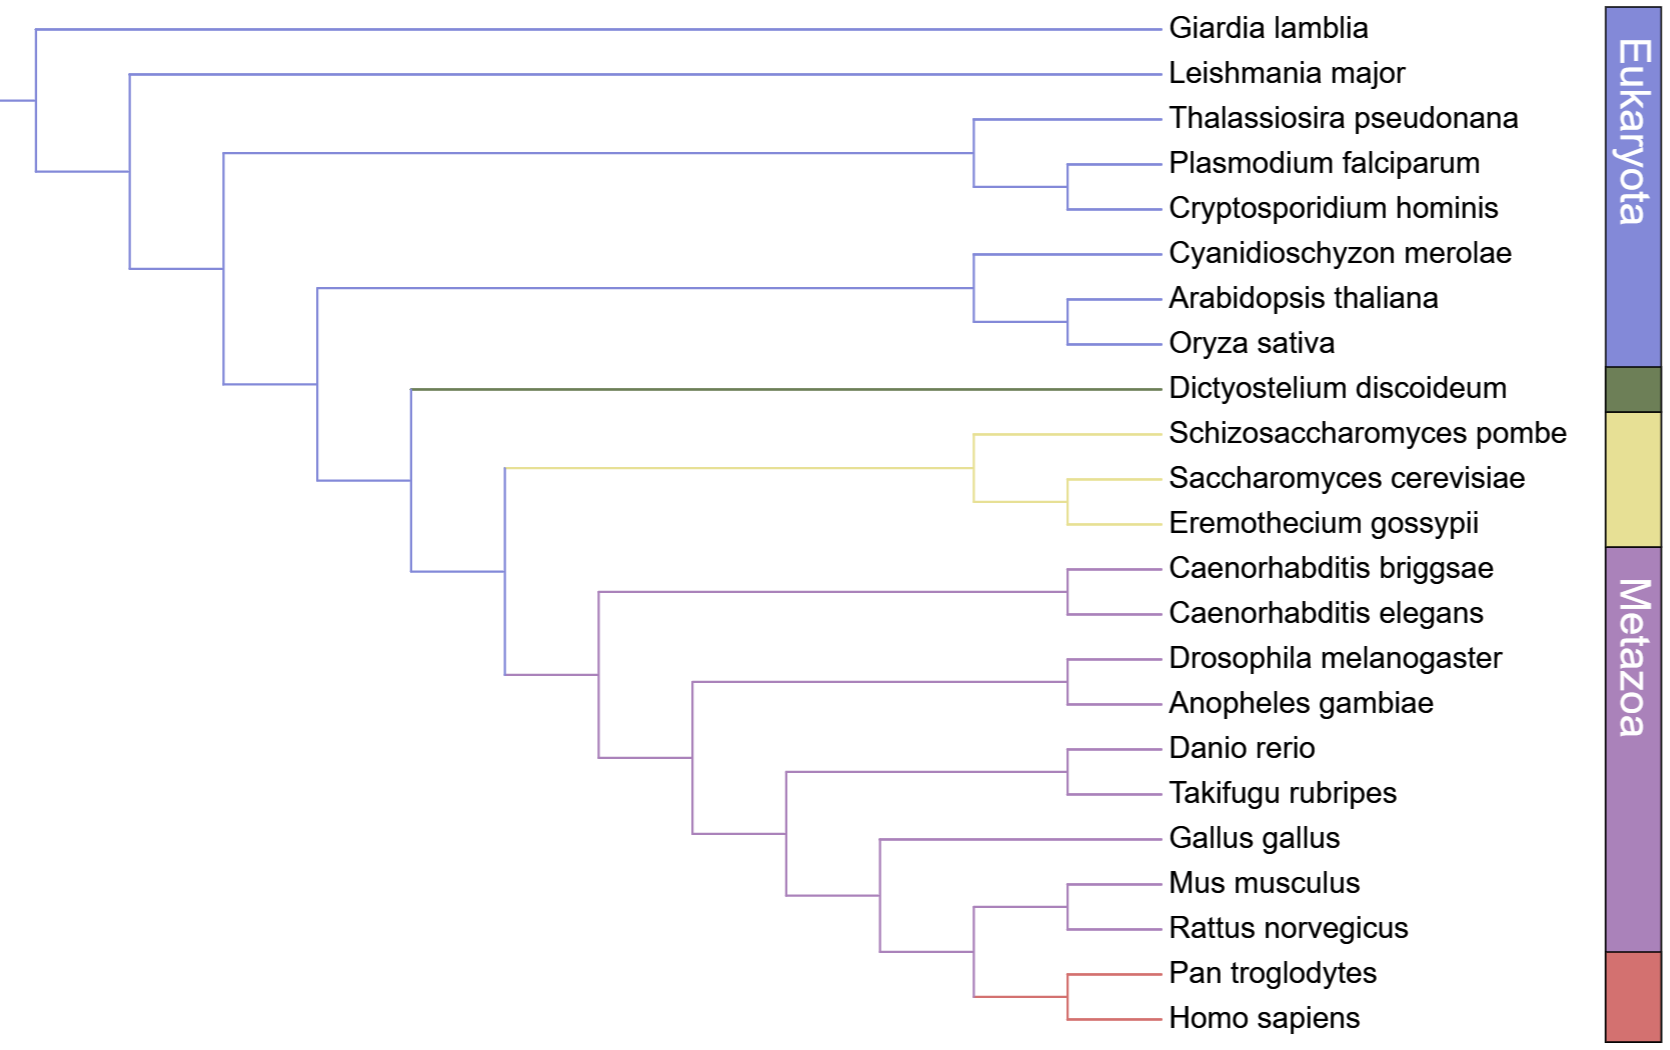
Display modes
Tree display modes
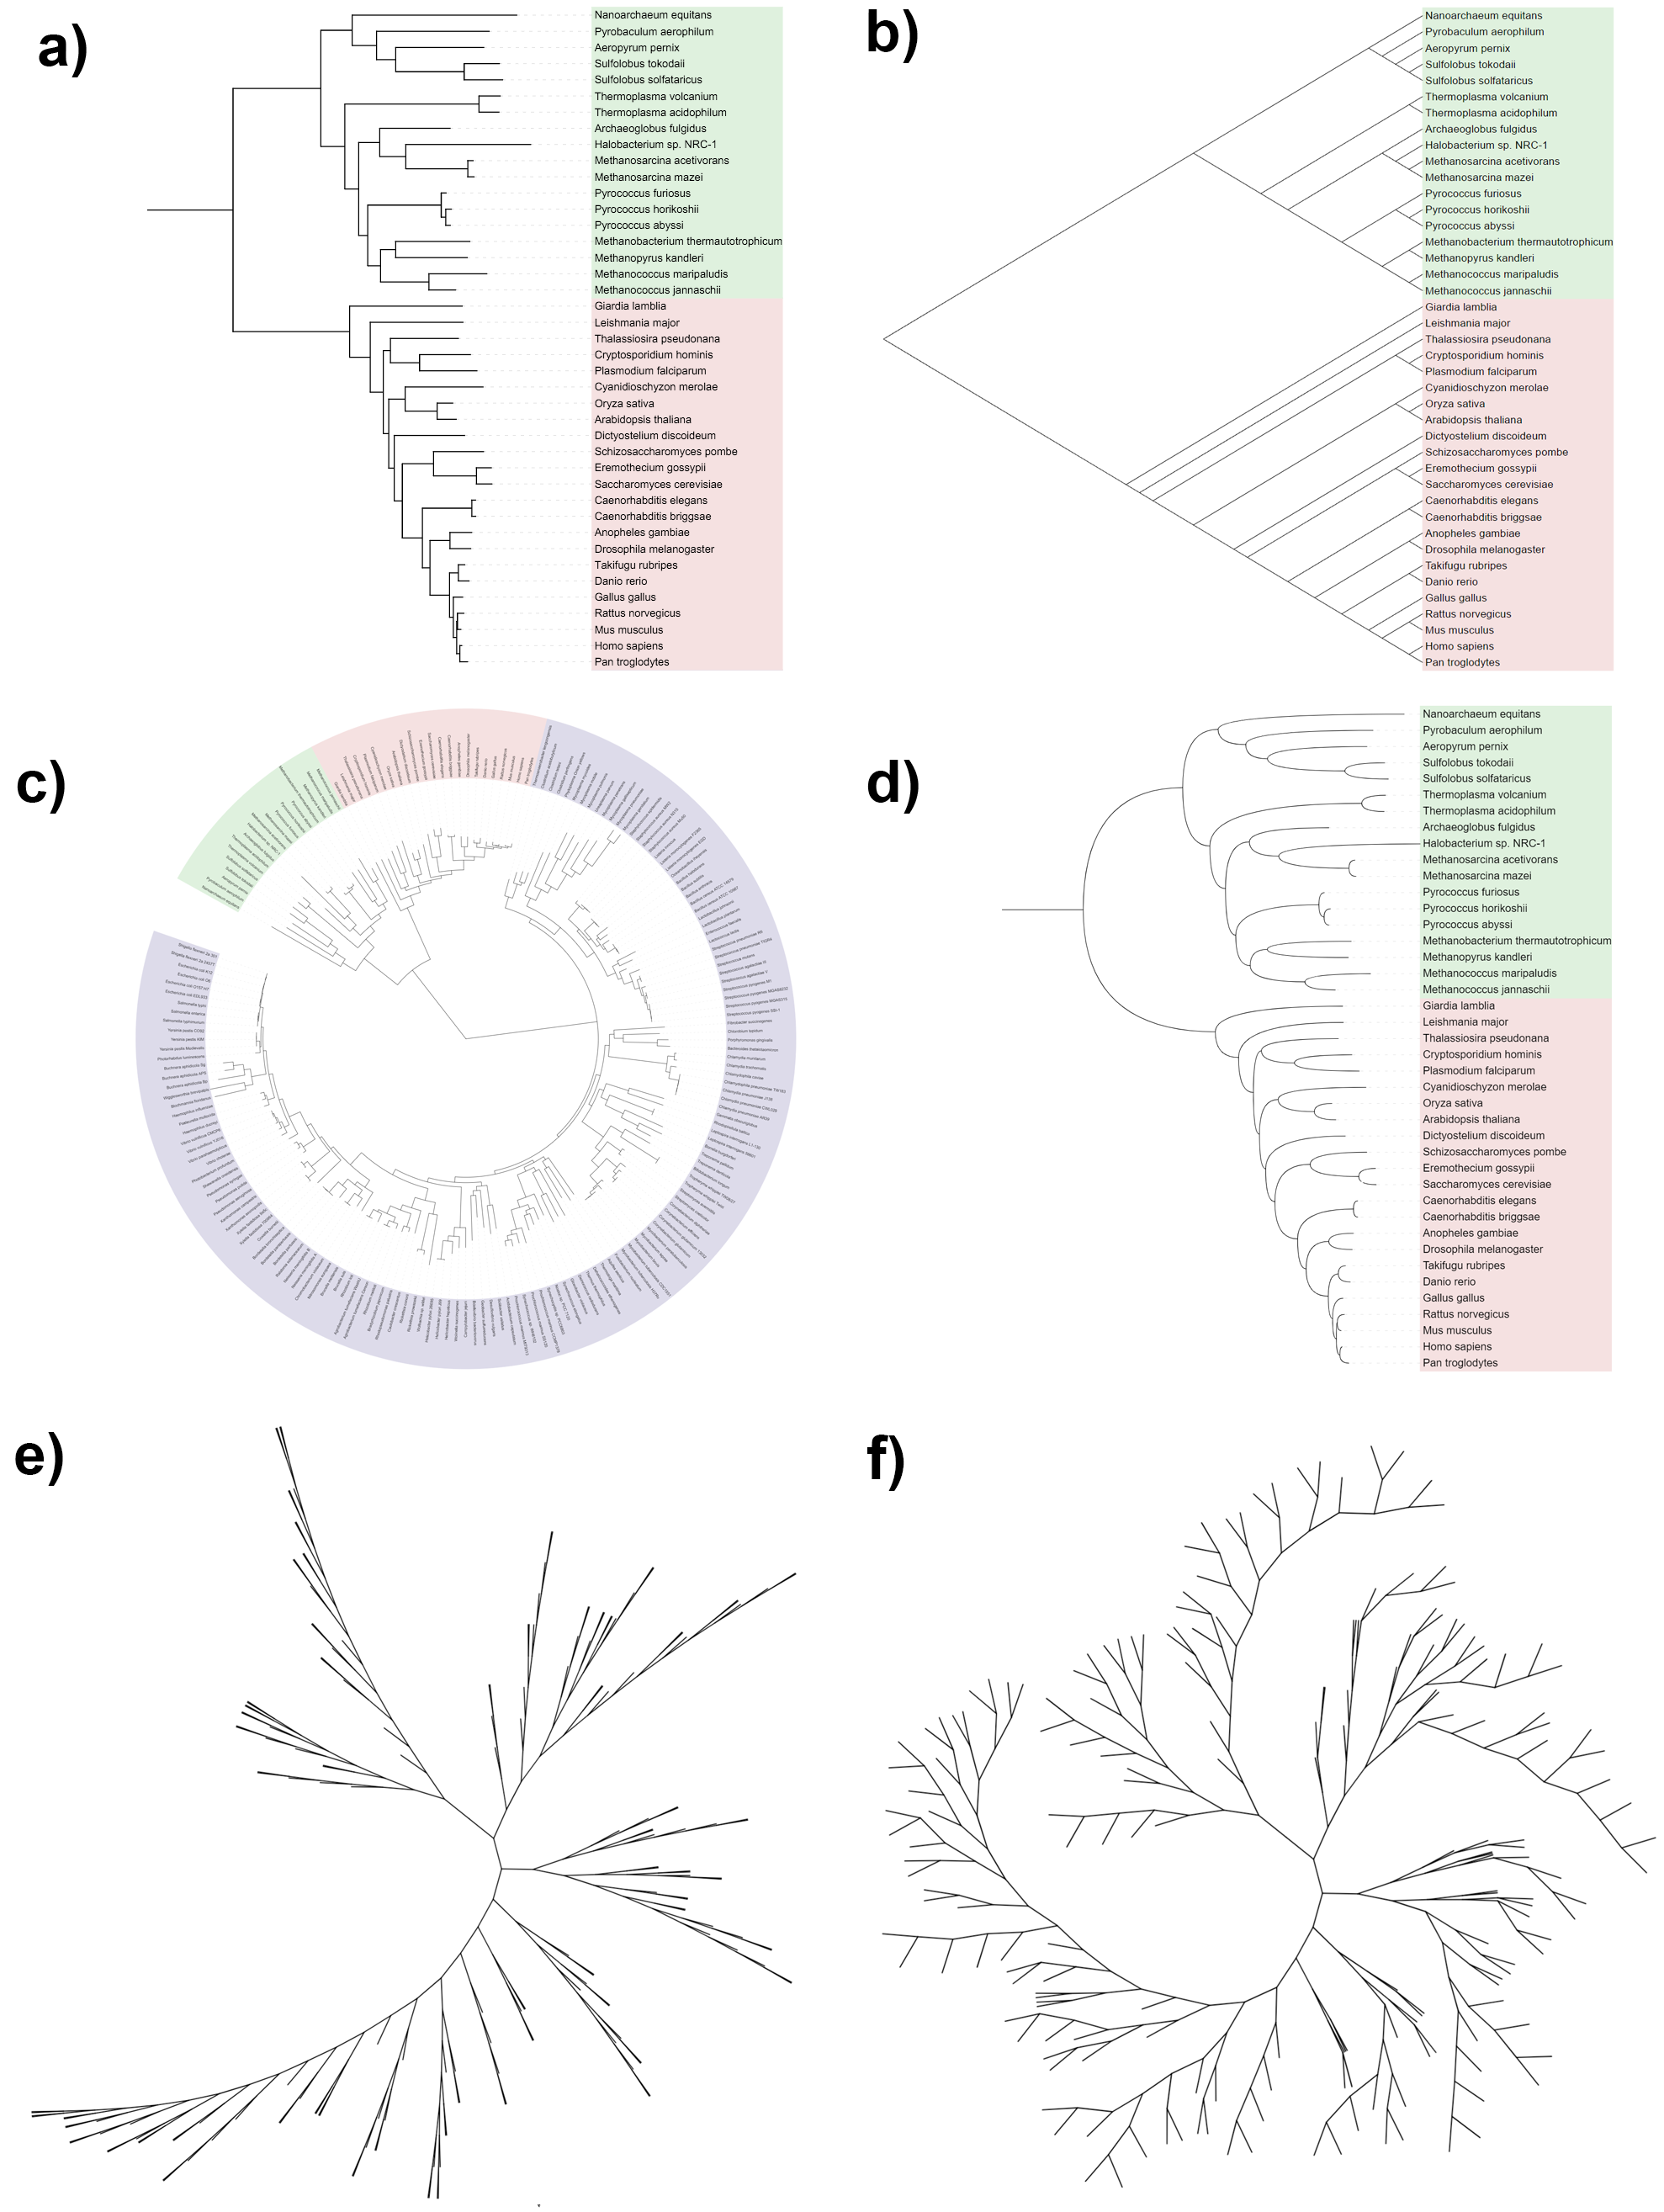
iTOL can display phylogenetic trees in several modes:
- Rectangular
- Slanted (triangular)
- Circular
- Curved branches (in rectangular or circular modes)
- Unrooted (radial), equal-angle
- Unrooted (radial), equal-daylight
To switch the display mode, click the corresponding button in the Mode section on the top of the Basic controls tab.
Trees which contain branch length information will be displayed as phylograms by default. To display them as cladograms and ignore the branch length information, toggle the Branch lengths setting in the Mode options section to Ignore.
Slanted mode is a special variation of the rectangular display mode. To display a tree in slanted mode, first switch the display mode to Rectangular, and then toggle the Slanted setting in the Mode options section to Yes.
Tree display can be further customized through several options in the Basic and Advanced tabs of the control panel:
- Rotation: is used to rotate the whole tree clockwise by the specified angle (in degrees)
- Arc: is used to define the total angle which the tree will cover in the circular mode (default is 350°)
- Invert tree: rectangular and circular tree displays can be inverted by using this option
- Equal-daylight: unrooted display mode uses the so called 'equal-angle' algorithm by default, which normally produces crowded leaves with large empty areas between clades. 'Equal-daylight' algorithm (e.g. citation) produces layouts which show the tree structure more clearly. Up to 5 iterations of the algorithm can be applied. Note that branch overlaps can occur when more than 1 iteration is applied. Using mid-point rooted trees usually minimizes the overlap issues.
- Label options: change the font family, style, size and color of all tree labels. Click the icon to prevent the automatic calculation of label font sizes.
- Branch options: change the width and color of tree branches, and switch between straight and curved lines. Style of the dashed connection lines can be changed here as well.
- Scaling factors: increase/decrease the horizontal or vertical scale, stretching/shrinking the tree in the selected dimension
- Leaf sorting: by default, iTOL will put the clades with fewer leaves to the "top" (when looking at a tree in rectangular mode), resulting in a nicer, stair-like display. This option can be used to disable the sorting and use the original order as defined in the tree file.
Bootstrap values and other node metadata
Template file: metadata.txt
Supported by the iTOL annotation editor for spreadsheets
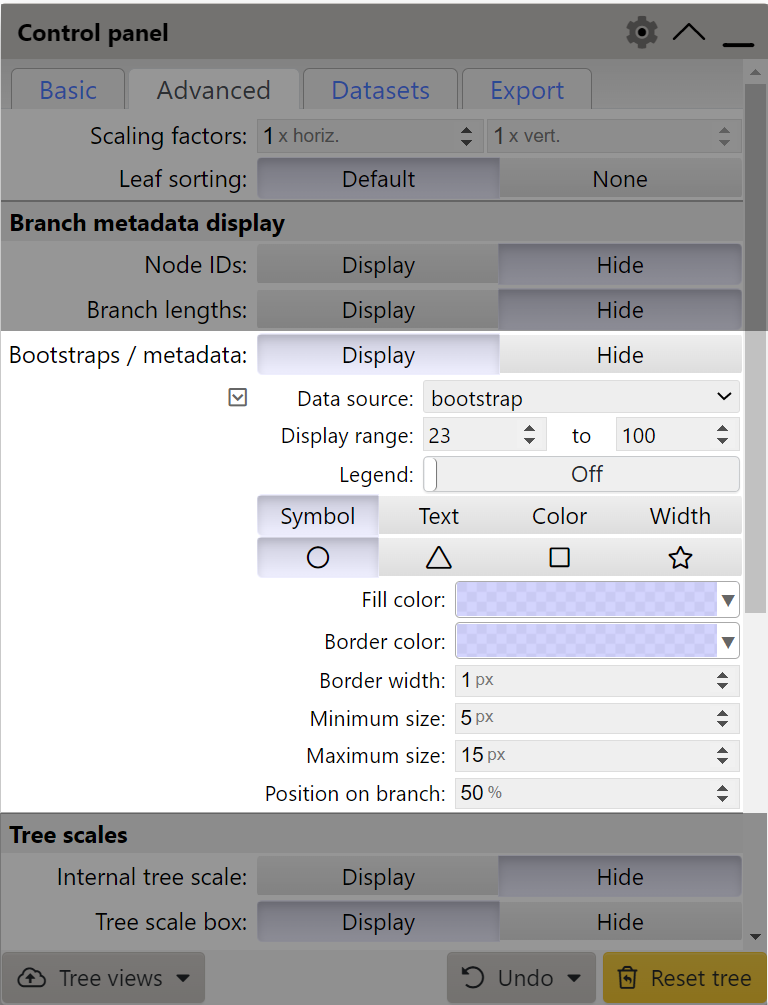
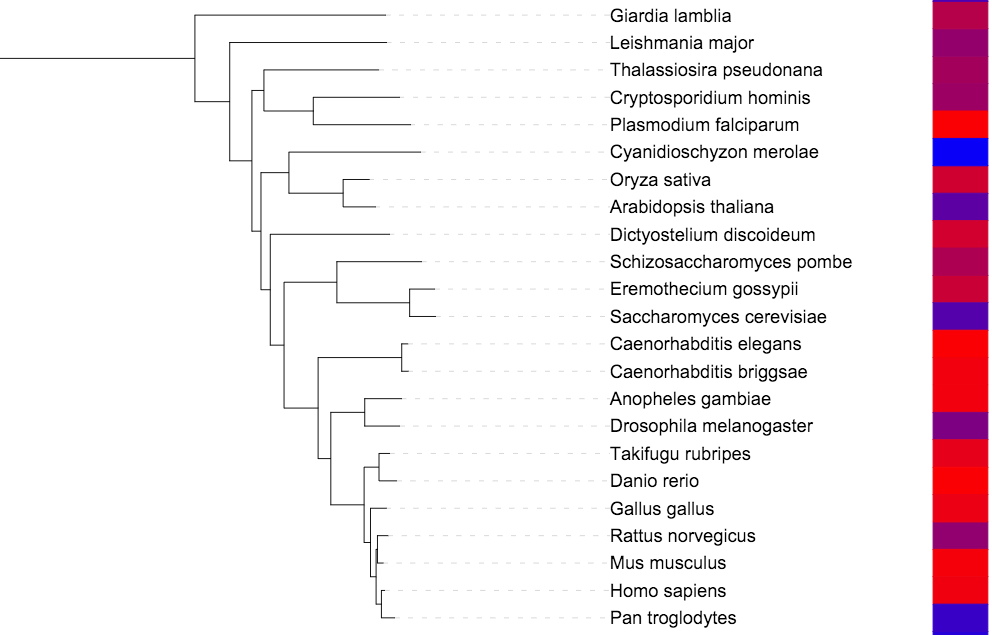
Bootstrap and other metadata display options
If a tree contains bootstrap information, or other metadata (such as various MrBayes metadata fields), these can be visualized by setting the Bootstraps / metadata option to Display. Select the desired metadata source using the Data source selector, and set the Display range values to select the range which should be displayed. By default, all values are included. If multiple metadata fields are defined, multiple threshold ranges can be defined simultaneously, by clicking the button.
Node metadata can be added or changed interactively through the metadata editor, which can be accessed via the functions menu. For bulk metadata updates, use iTOL annotation editor for spreadsheets, or the template file linked above.
The metadata can be visualized in 4 different ways:
- Symbol: select the shape type, minimum and maximum size and the fill color. Border color and width can be also be changed. Minimum/maximum sizes selected will be used as the radii/sizes for the shapes corresponding to the minimum/maximum metadata value. Note that the minimum size can be larger than maximum, ie. the display will be reversed, with lower metadata values having a larger size. Position of the symbol along the branch can also be adjusted.
- Text: values will be displayed as text labels directly on the branches. Font size, numeric style and the position of the label can be adjusted. To make the labels more readable, you can display a background box behind them by setting the Label background to 'On'. Background color can be changed, as well as the border width, color and corner radius of the box.
- Color: tree branches will be colored according to their metadata values and the color gradient defined in the control box. For non-numeric metadata sources, colors will be assigned automatically, and can be edited by clicking the Define colors button.
- Width: tree branch widths will be set according to their metadata values. Minimum/maximum widths selected will be used as the widths for the branches with minimum/maximum metadata value. Note that minimum width can be larger than maximum, ie. the widths will be reversed, with lower metadata values having a wider branch.
Note that non-numeric metadata sources can only be visualized as branch colors or text labels.
If the metadata is visualized as symbols or branch colors, a corresponding legend can be added to the tree by setting the Legend toggle to On. Symbol size in the legend will exactly match the size in the tree at the current zoom level. If you change the tree zoom, you can update the legend by toggling its display off and back on.
Range metadata
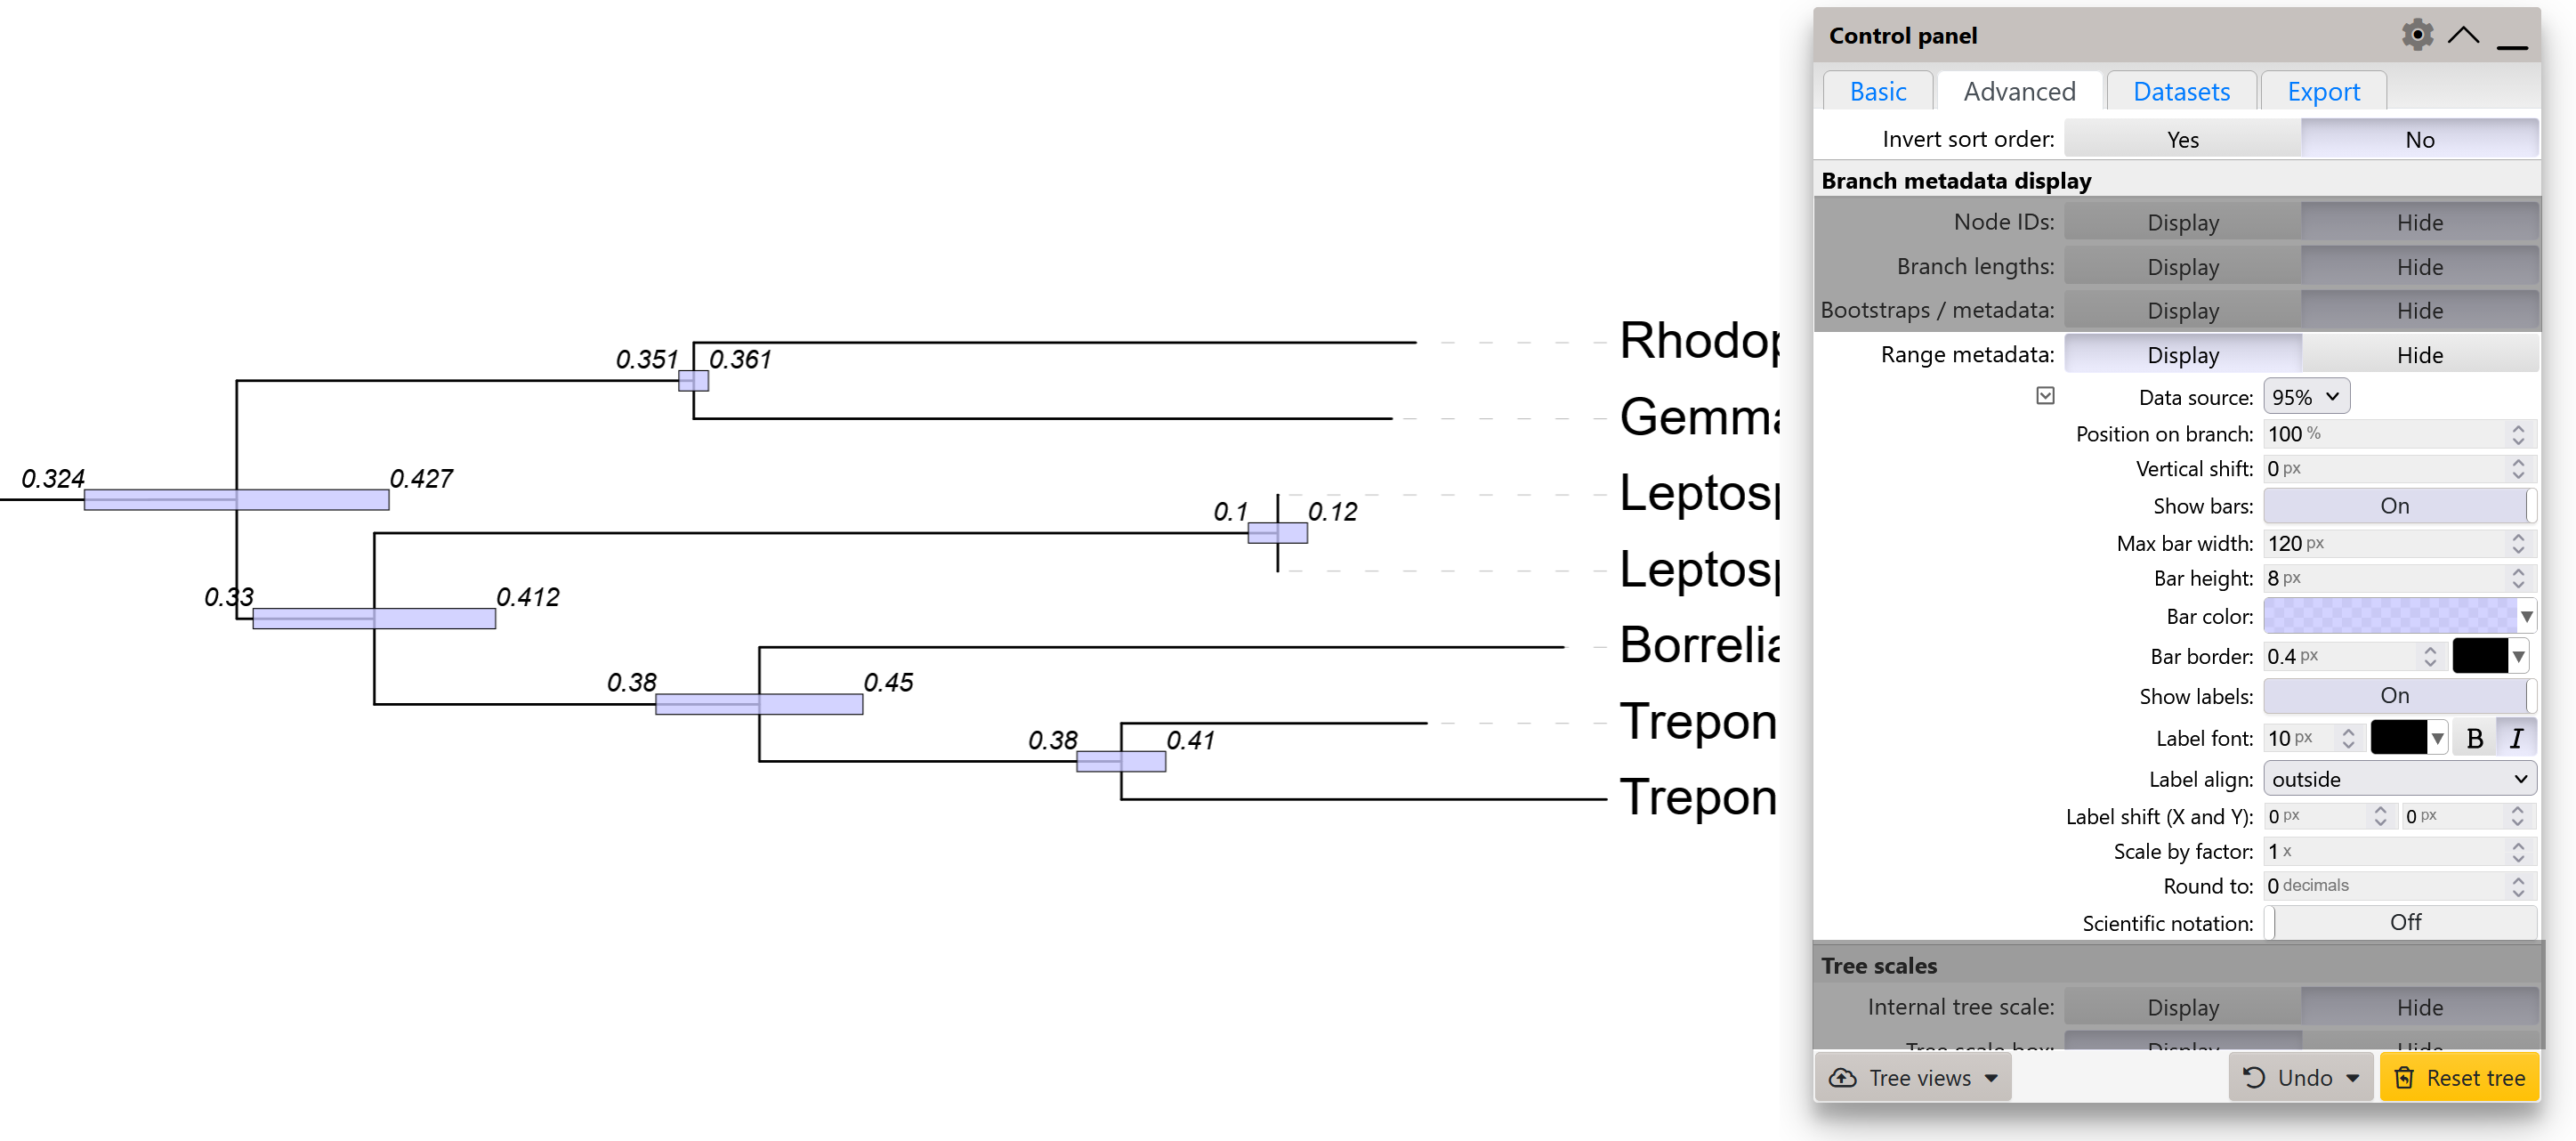
Displaying range metadata as bars
Range type metadata (e.g. various Highest Posterior Density ranges, such as height_95%_HPD or length_95%_HPD) can be visualized by setting the Range metadata option to Display. Select the desired range metadata source using the Data source selector.
Ranges will be visualized as bars (with optional whiskers) directly on the nodes. Bar and whisker style can be customized.
In addition to the bars, the actual range value labels can be displayed next to the bars.
Branch lengths and the tree scales
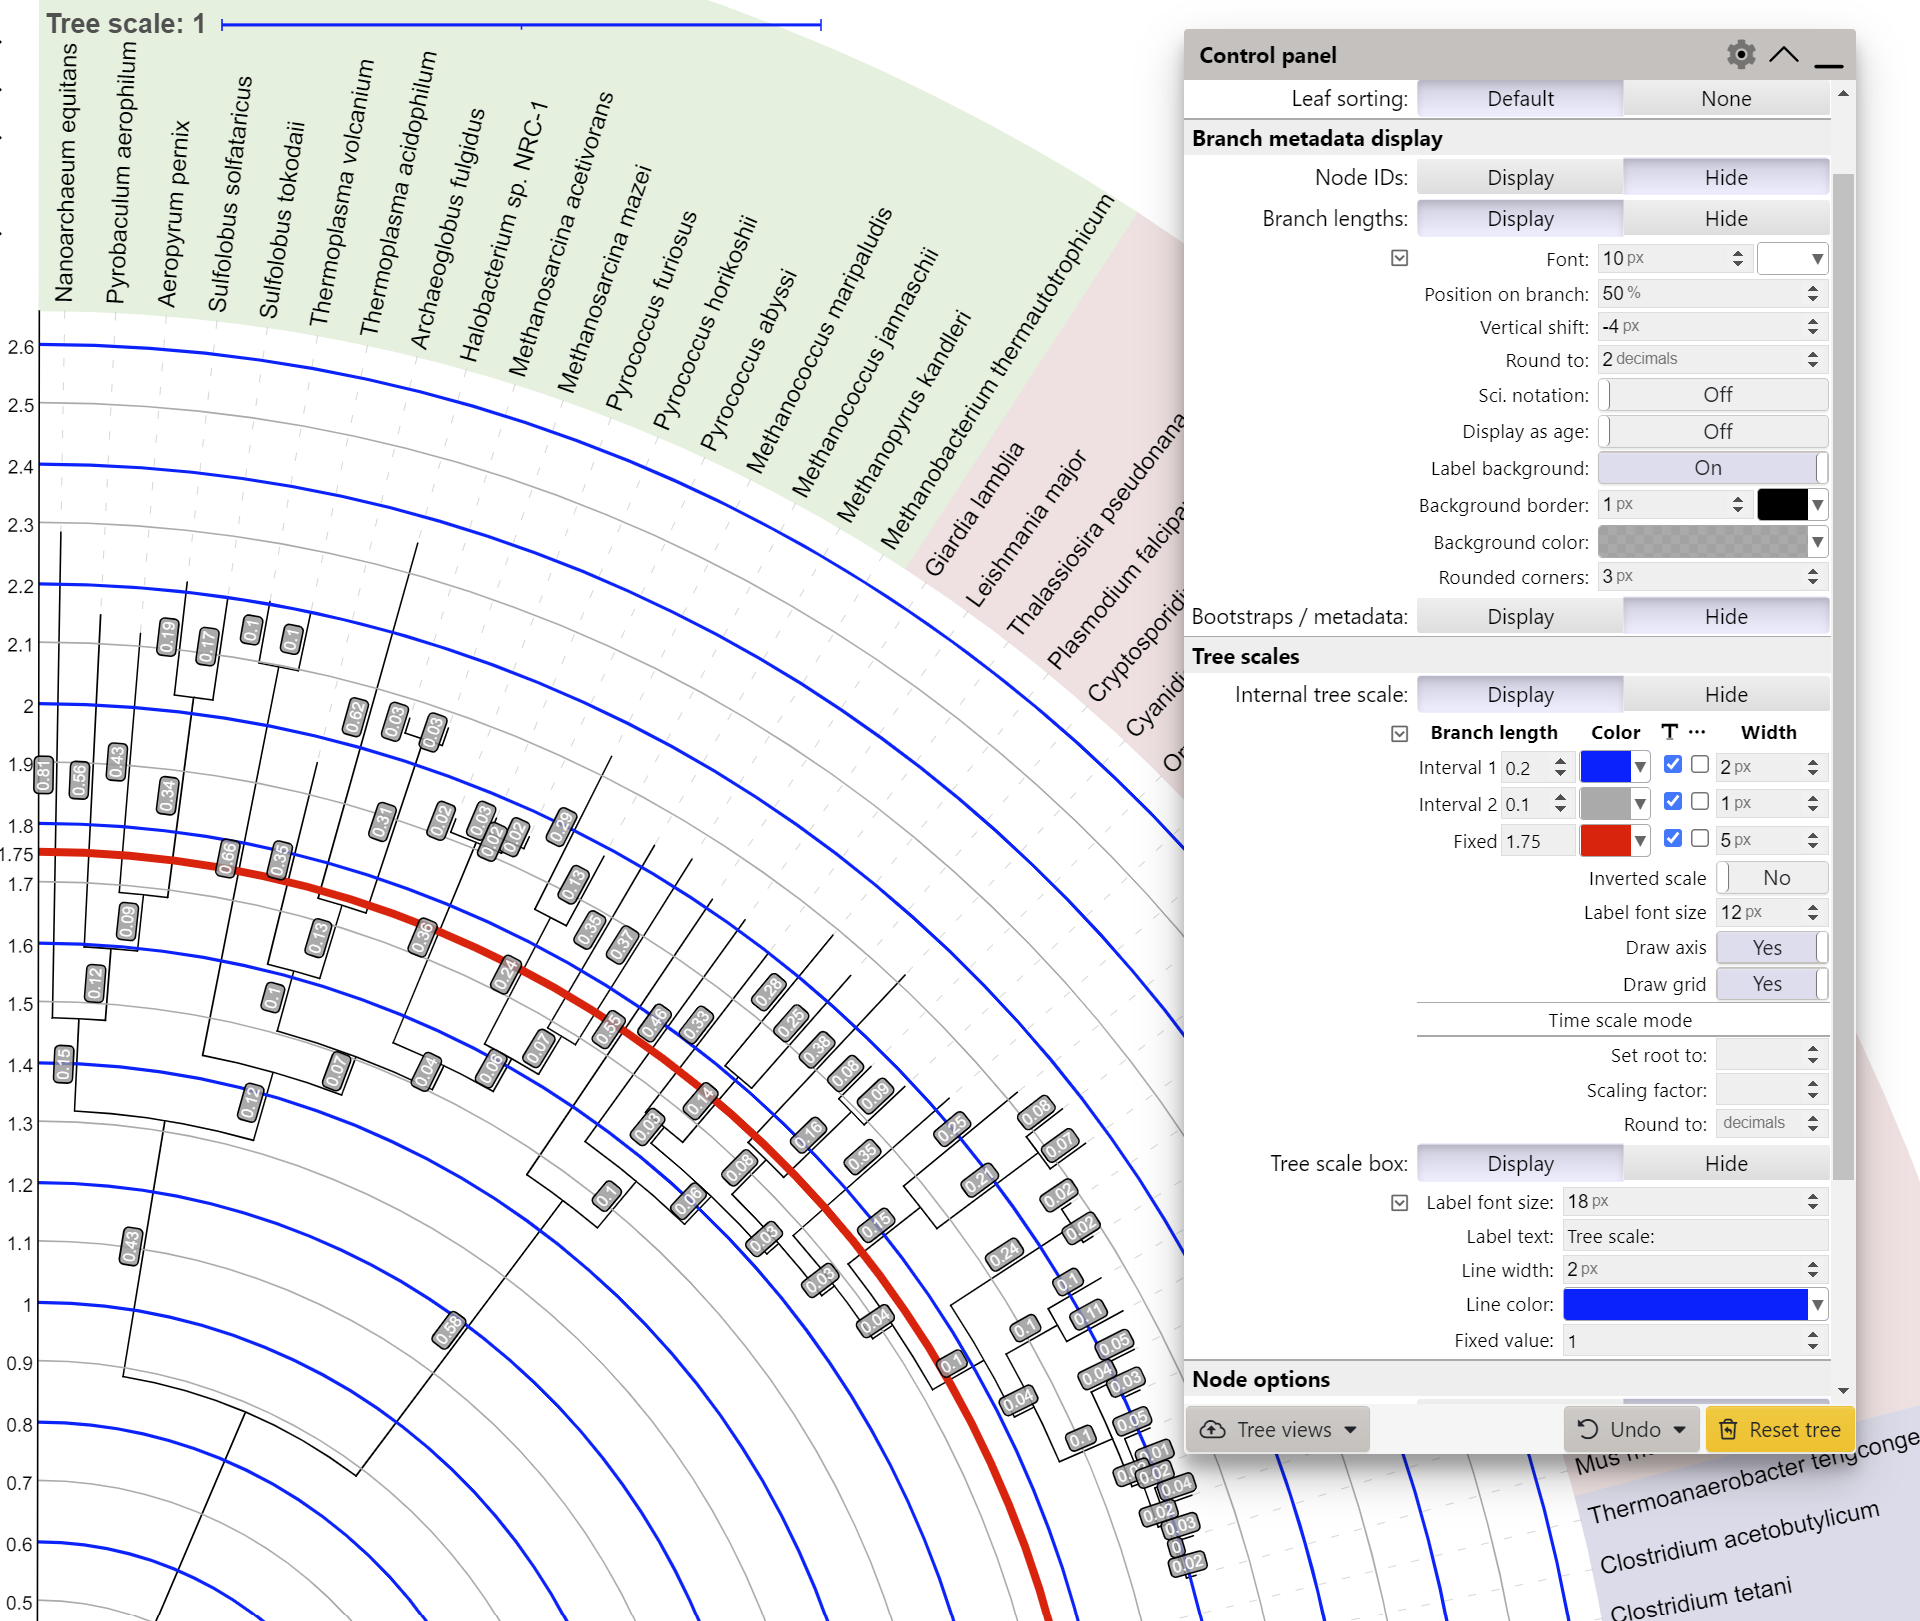
Branch lengths and tree scales
If a tree contains branch length information, these values can be visualized by setting the Branch lengths option under the Branch metadata display section to Display. Values will be displayed as text labels directly on the branches. Position, size, color and numeric style of the labels can be adjusted.
To make the labels more readable, you can display a background box behind them by setting the Label background to 'On'. Background color can be changed, as well as the border width, color and corner radius of the box.
By selecting the Display as age option, node ages will be displayed instead of raw branch length values. Farthest leaf in the tree has the age zero, and the age increases towards the root of the tree.
In addition, an internal tree scale and axis can be displayed by setting the Internal tree scale option to Display. You can set the interval values, colors and widths for 2 different sets of the scale lines. In addition, a set of fixed lines can be defined in the 'Fixed' input box. Provide a comma delimited list of values, and scale lines will be displayed at each value starting from the tree root (or tree top, if the scale is inverted). Each set of lines can be displayed as dashed by selecting the corresponding checkbox.
In time scale mode, you can customize the internal tree scale to display other values, and not the branch lengths directly. Simply provide a numeric value which should be used for the tree root (or tree top, if the scale is inverted), and the scaling factor for the branch lengths.
The Tree scale box section provides the options for the customization of the main tree scale indicator which is displayed in the top left corner of the tree display.
Truncating long branches
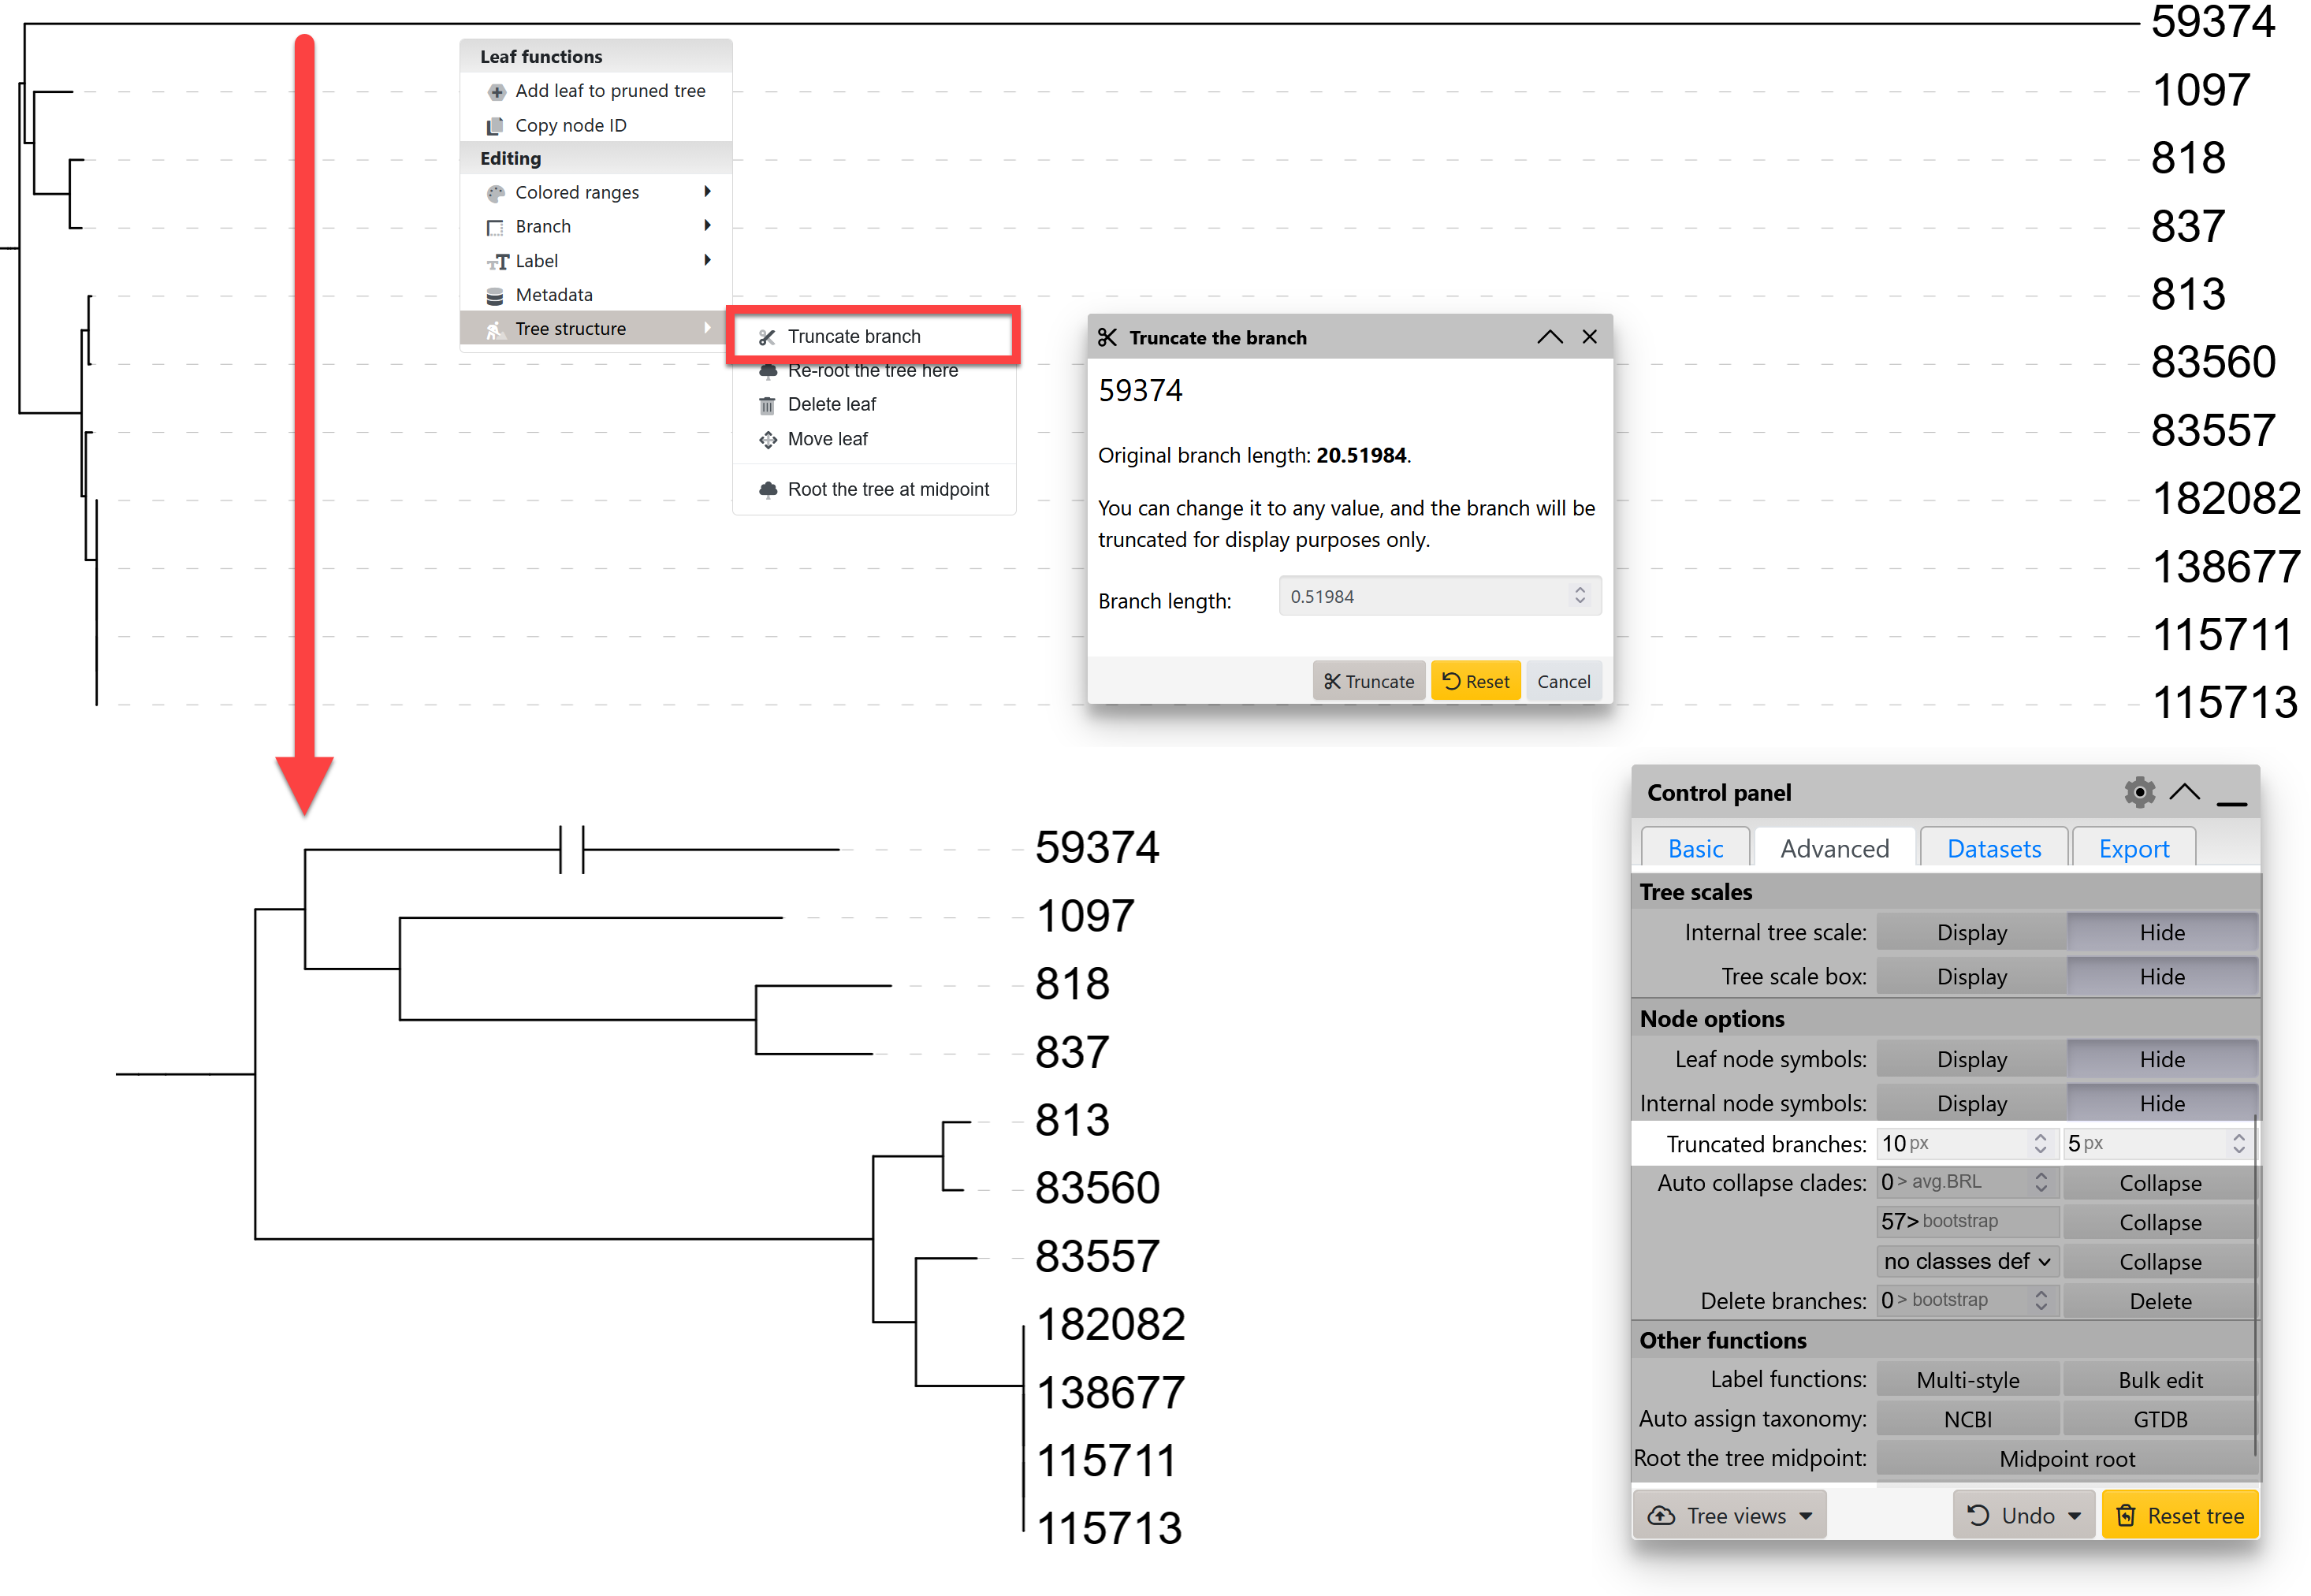
Truncating a long branch
If some of the tree branches are significantly longer than the average, creating a highly compressed view of the rest of the tree, you can truncate them. Use the corresponding function in the node functions menu, under the Tree structure section.
Set the desired new branch length in the popup dialog, and the branch will be displayed with a break in the middle to denote the truncated status.
The width and distance of the break lines can be adjusted through the Node options section of the advanced controls tab.
Node symbols
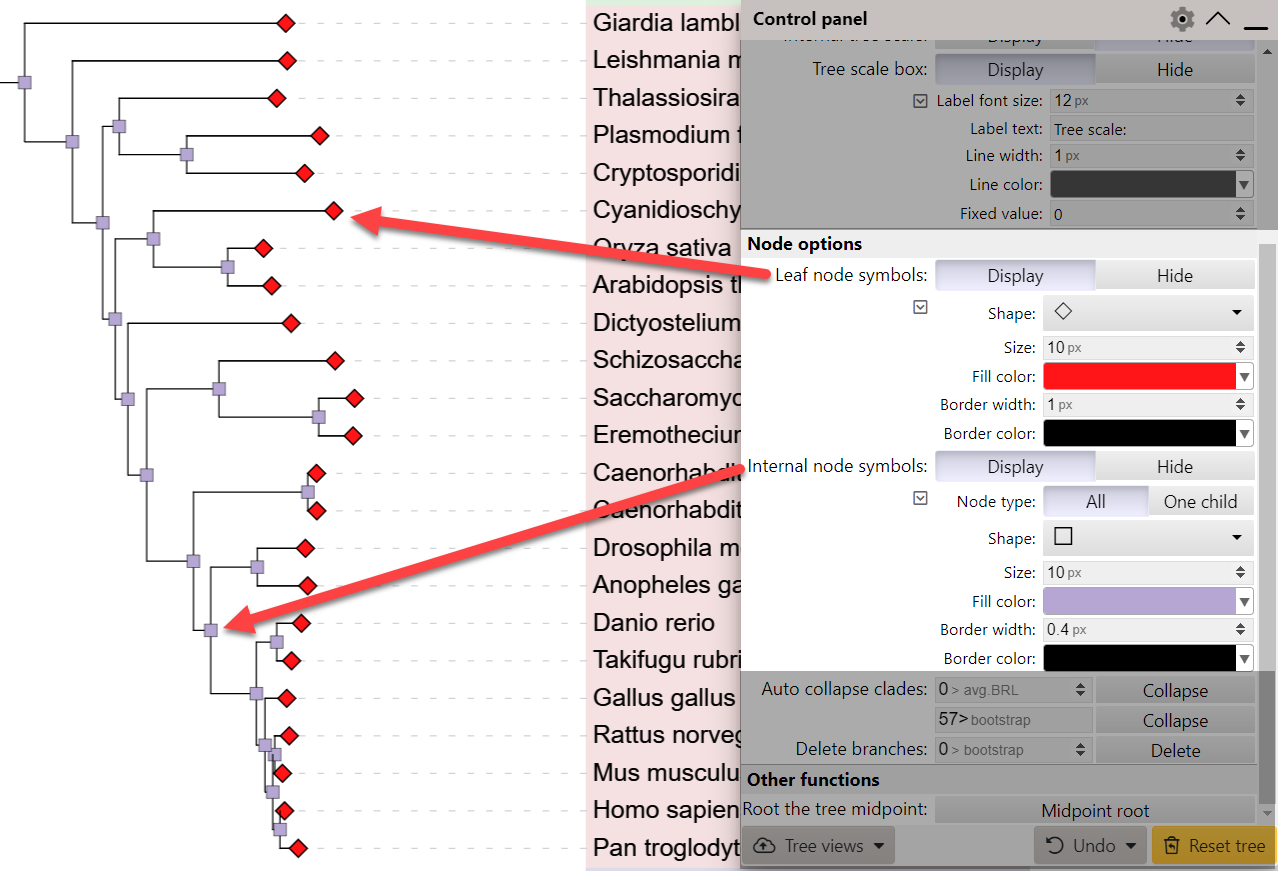
Node symbols
To quickly mark the positions of leaves or internal tree nodes with symbols, use the corresponding functions on the Advanced controls tab. The shape, size, fill color, border width and color can be independently set for leaves and internal nodes.
For the internal node symbols, you can set the node type to One child, which will restrict the display of symbols to nodes which have a single child node. This can be useful to quickly identify internal nodes which do not branch.
Node ID display
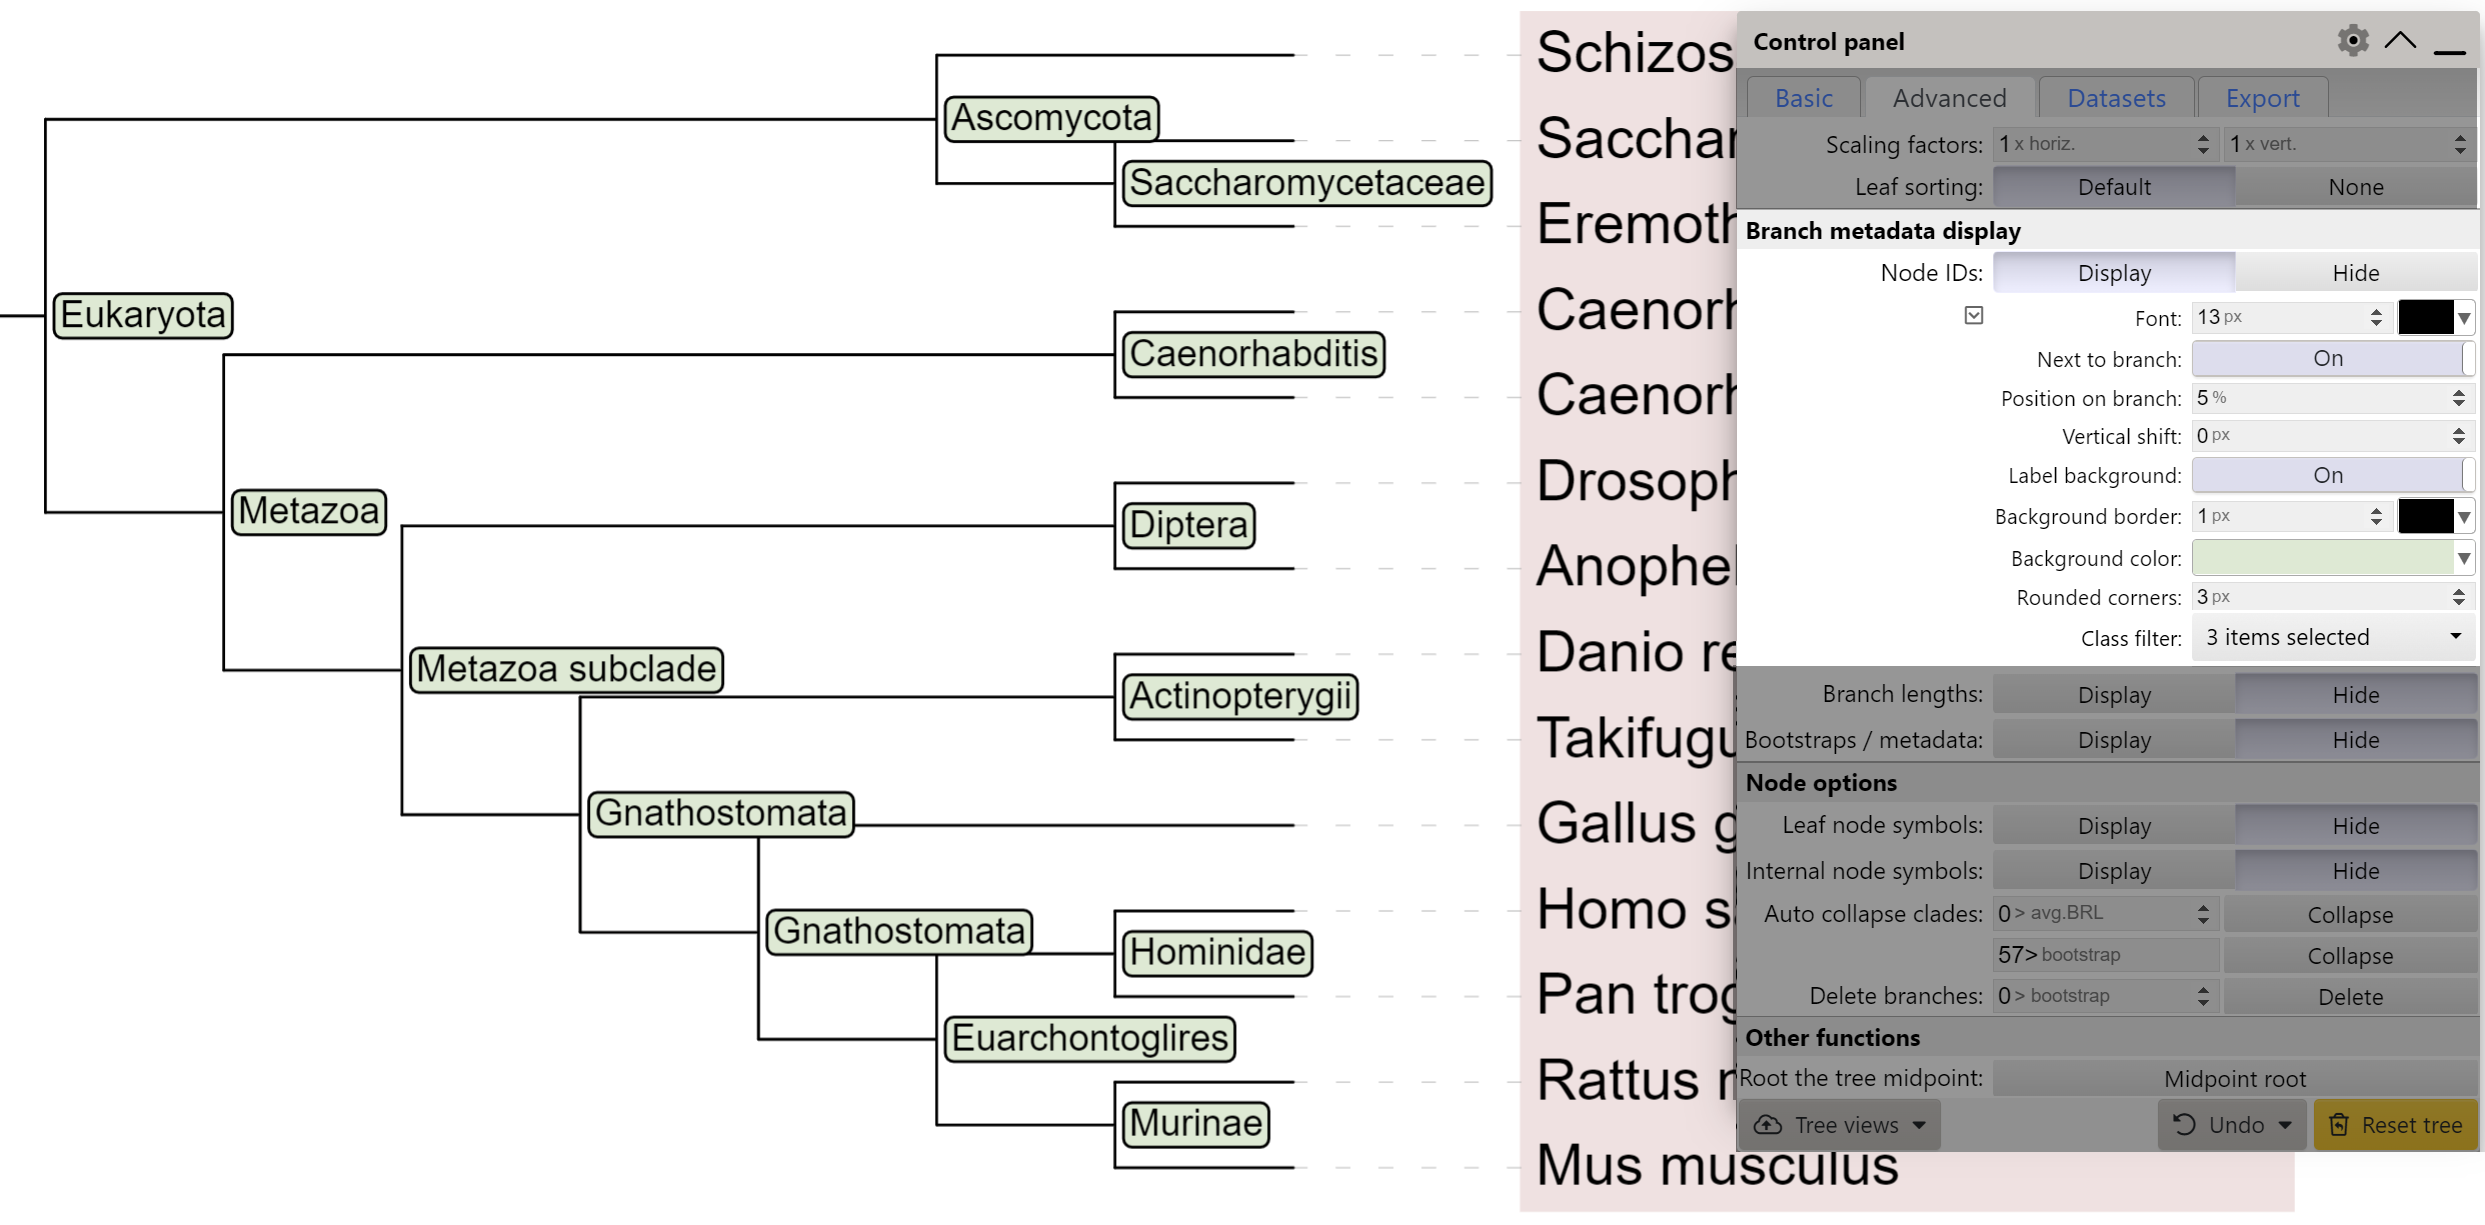
Displaying internal node labels
If your tree has internal node IDs defined, you can display them directly on the branches as text labels. If the IDs were not present in the original tree file, you can define them by using a LABELS annotation file, or by using the iTOL annotation editor for spreadsheets. Alternatively, you can edit the labels directly in the web interface, through the node functions menu (Editing → Labels → This node → Edit label).
By default, node labels will be displayed next to the node. To display them above the branch itself, set the Next to node option to No.
To make the labels more readable, you can display a background box behind them by setting the Label background to 'On'. Background color can be changed, as well as the border width, color and corner radius of the box.
If node classes are defined in the tree, these can be used to limit the node ID display. You can select one or more classes through the Class filter option, and only these node ID will be displayed.
Node functions menu
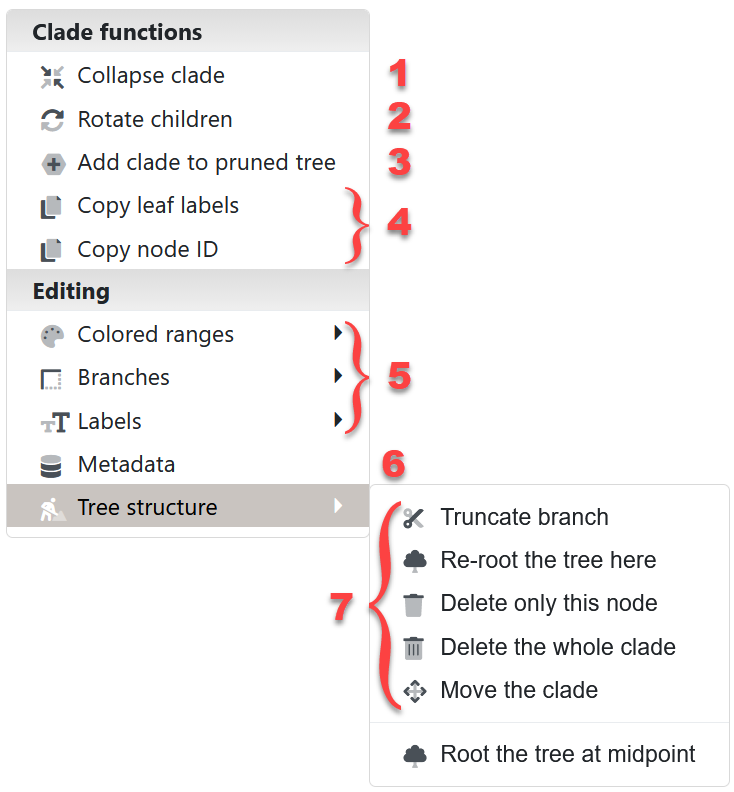
Node functions menu
Click on any tree branch or leaf label to display the node functions menu. Depending on the node type and the current tree state, some menu options may be disabled.
- Collapsing clades is described in more detail below
- Rotate children: switch the position of selected node's children
- Tree pruning is described in more detail below
- Copy leaf labels or node ID: Copy the node ID to the system clipboard for easy inclusion in annotation files or datasets. For an internal node, you can also copy the labels of all its child leaves.
- Interactive annotation: Working with Colored ranges and branch/label styles is described in separate sections below. Individual leaf node spacing can be set through the Branches submenu.
- Metadata editing: Edit the metadata values associated with any node. Metadata fields can also be renamed or deleted here.
- Tree structure editing: Use these functions to re-root the tree, delete nodes or whole clades, move nodes to a new location or truncate long branches. Regardless of the node clicked, you can also re-root the tree at midpoint with the function at the bottom of this submenu.
Collapsing clades
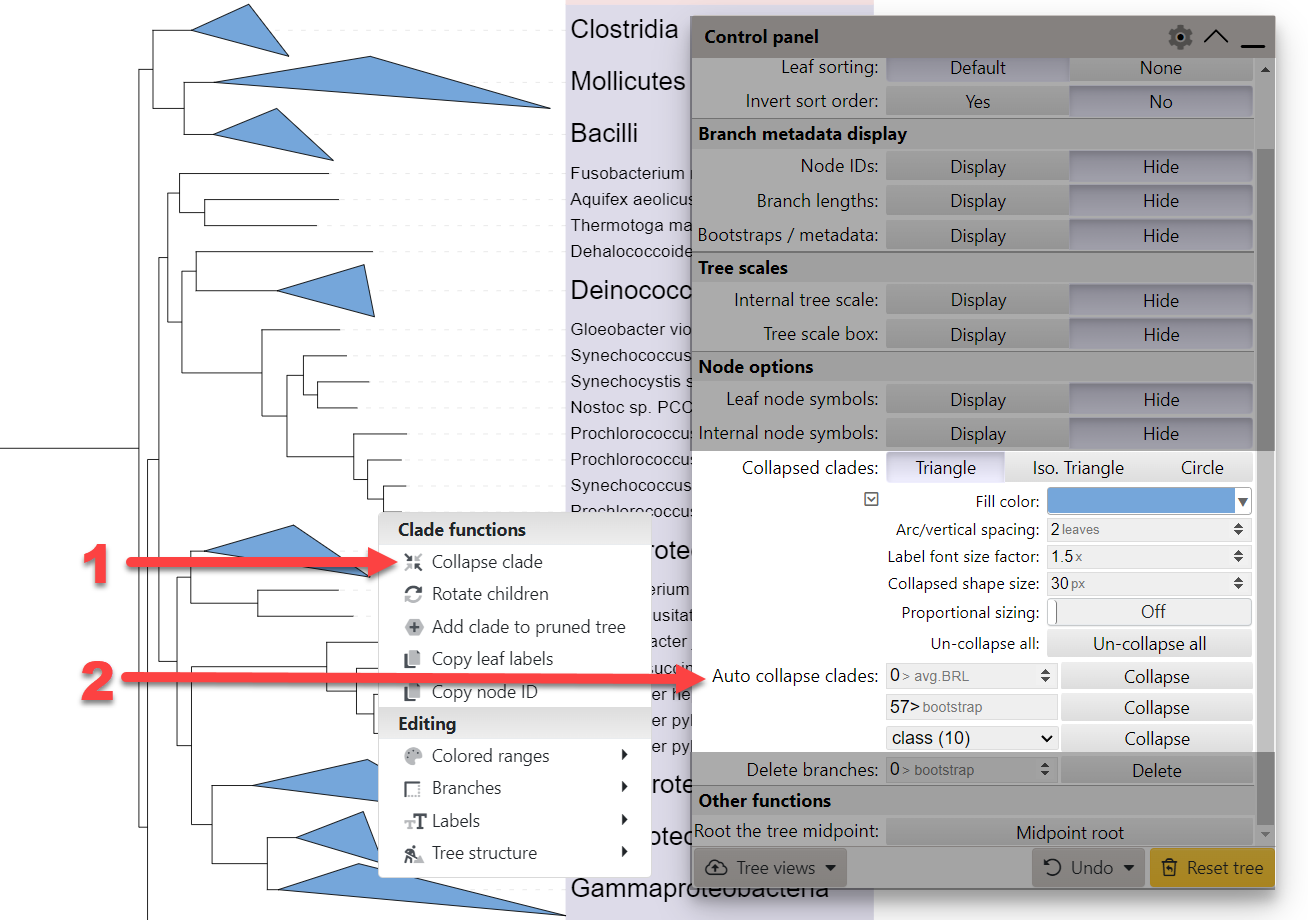
Collapsing tree clades
Template file: collapse.txt
To collapse a clade, select Collapse clade from the node functions menu (1).
You can also use the template file collapse.txt to specify a list of nodes to collapse. Simply drop the file onto the tree display, and all listed clades will be collapsed. If your tree does not have internal node IDs, you can use the last common ancestor method to define the the nodes to collapse.
The Collapsed clades section of the Advanced controls tab contains various options related to the display of collapsed clades.
By default, collapsed clades will be displayed as triangles with two side lengths proportional to the distances to node's closest and furthest leaves. They can also be displayed as simple isosceles triangles or circles, whose size can be fixed or proportional to the number of leaves they contain.
To expand a collapsed clade, click on it and select Expand clade from the node functions menu.
iTOL also provides several functions for automatic collapsing of clades (2):
- Average branch length: Collapse all clades whose average branch length distance to their leaves is below the specified value.
- Bootstrap/metadata values: Collapse all clades whose bootstrap value is below or above the specified number. If the direction is not specified (by adding a < or > sign), values below the specified number will be matched. For multi-bootstrap or trees with node metadata, the metadata source selected under the bootstrap display section is used.
- Node class: Collapse all clades based on their assigned class. Node class can be specified in the LABELS annotation file, interactively through the metadata editing function, or by using the iTOL annotation editor. Trees with automatically assigned taxonomy have node classes available as well.
- Node ID: Collapse all clades based on their IDs/labels. Enter any text into the corresponding field, and click the collapse button. All clades whose IDs/labels contain this text (case sensitive) will be collapsed.
Pruning the tree
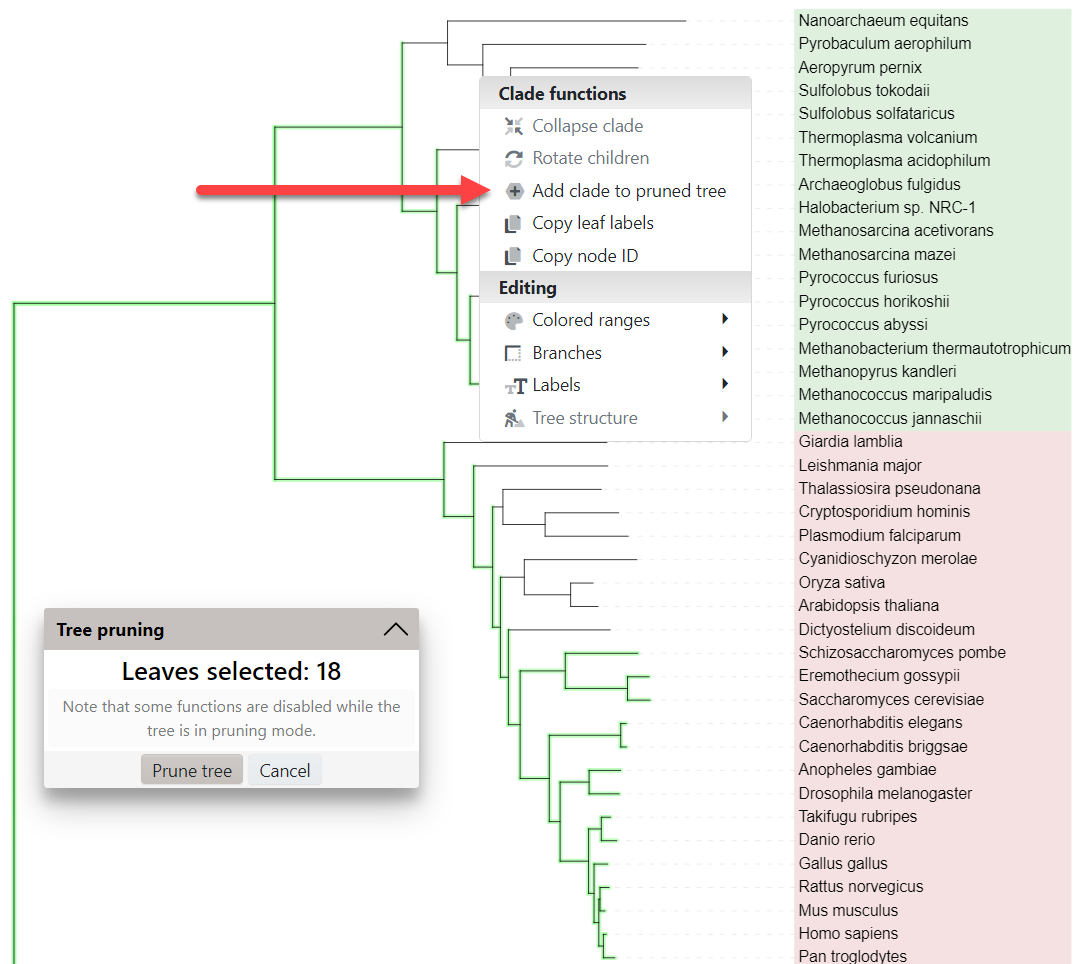
Pruning a tree
Template file: prune.txt
Pruning is a process of selecting one or mode clades and/or leaves from the original tree and creating a new, smaller tree.
To start pruning, select Add clade/leaf to pruned tree from the node functions menu. A small dialog will be displayed showing the total number of leaves selected. To remove clades or leaves from the selection, click them and select Remove clade/leaf from pruned tree.
When you have selected all nodes of interest, click the Prune tree button to display the new tree.
In addition to manually selecting the nodes of interest, you can also use the template file prune.txt to specify a list of nodes to prune. Simply drop the file onto the tree display, and all listed nodes will be included in the pruned tree.
Pruning information can be removed through the menu in the control panel footer.
Leaf node spacing
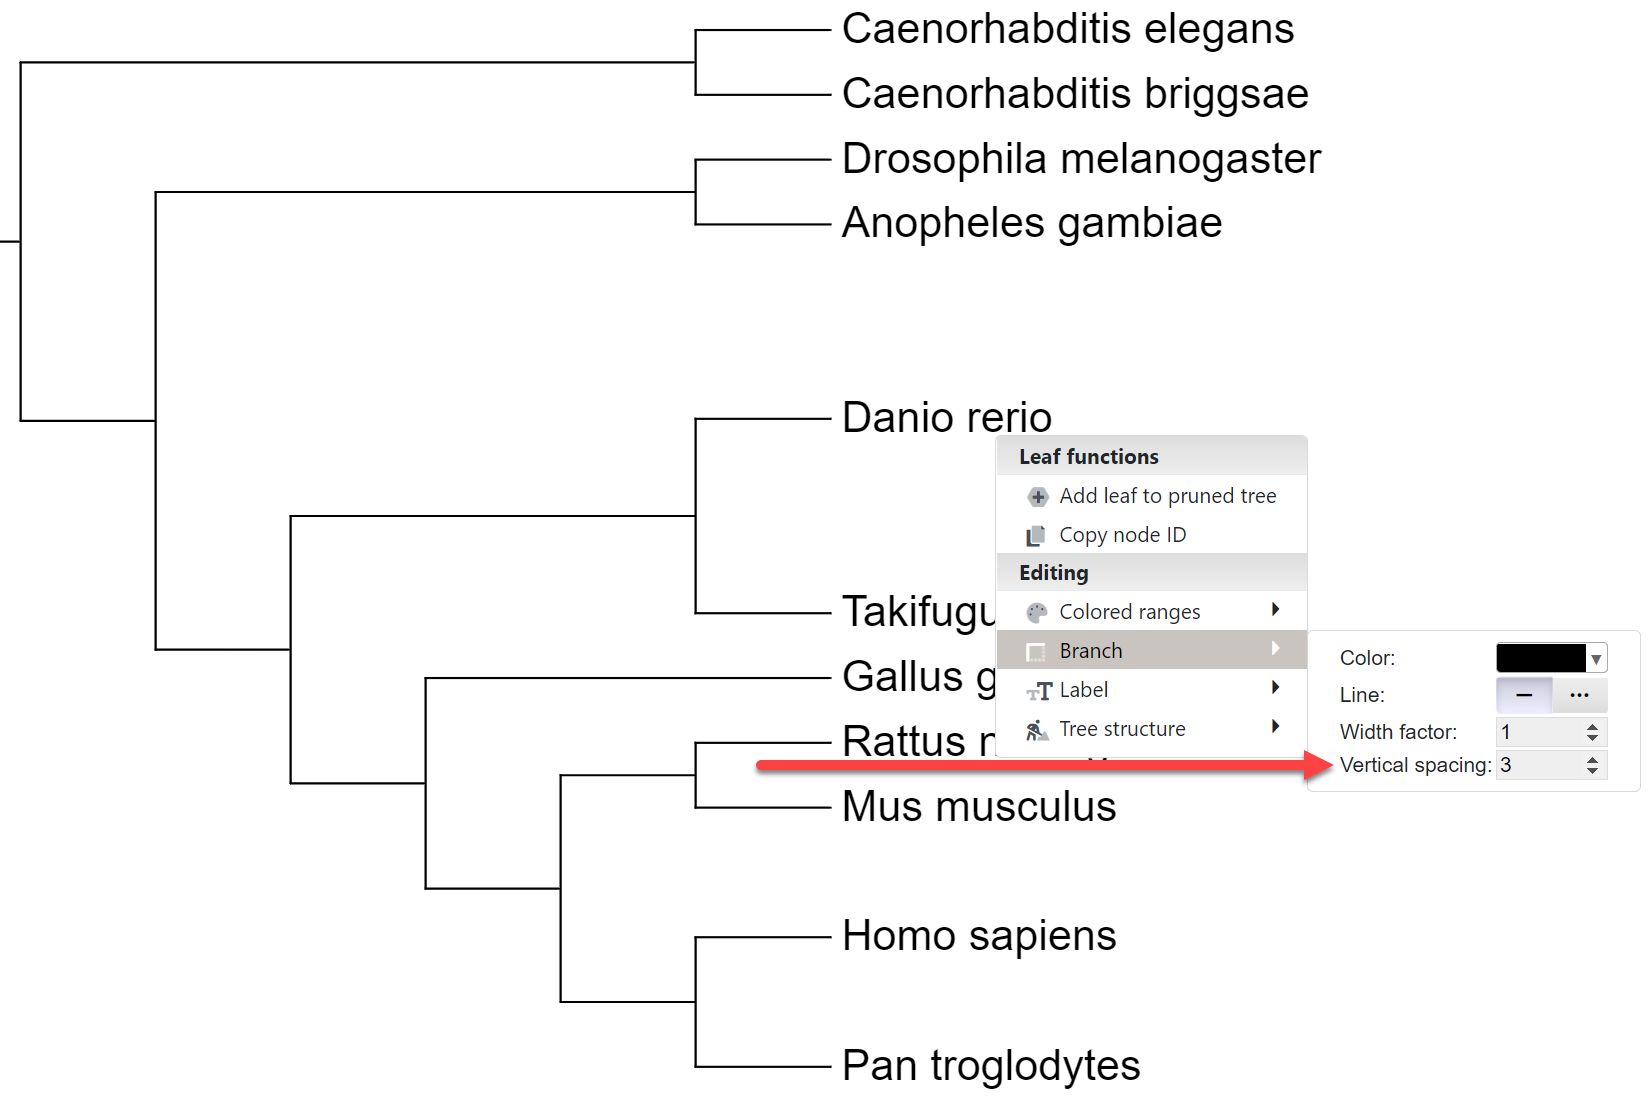
Vertical spacing of individual leaf nodes
Template file: spacing.txt
You can highlight individual leaves by increasing their vertical spacing to the neighbouring nodes. In the example on the right, Danio rerio has a vertical spacing factor of 3, while Homo sapiens has a factor of 2.
In addition to manually setting the vertical spacing for the nodes of interest, you can also use the template file spacing.txt to specify a list of nodes and their vertical spacing factors.
If the vertical spacing factor is smaller than 1, the spacing to the neighbouring nodes will be shrinked proportionally.
Vertical spacing information can be removed through the menu in the control panel footer, by selecting 'Reset all branch styles'.
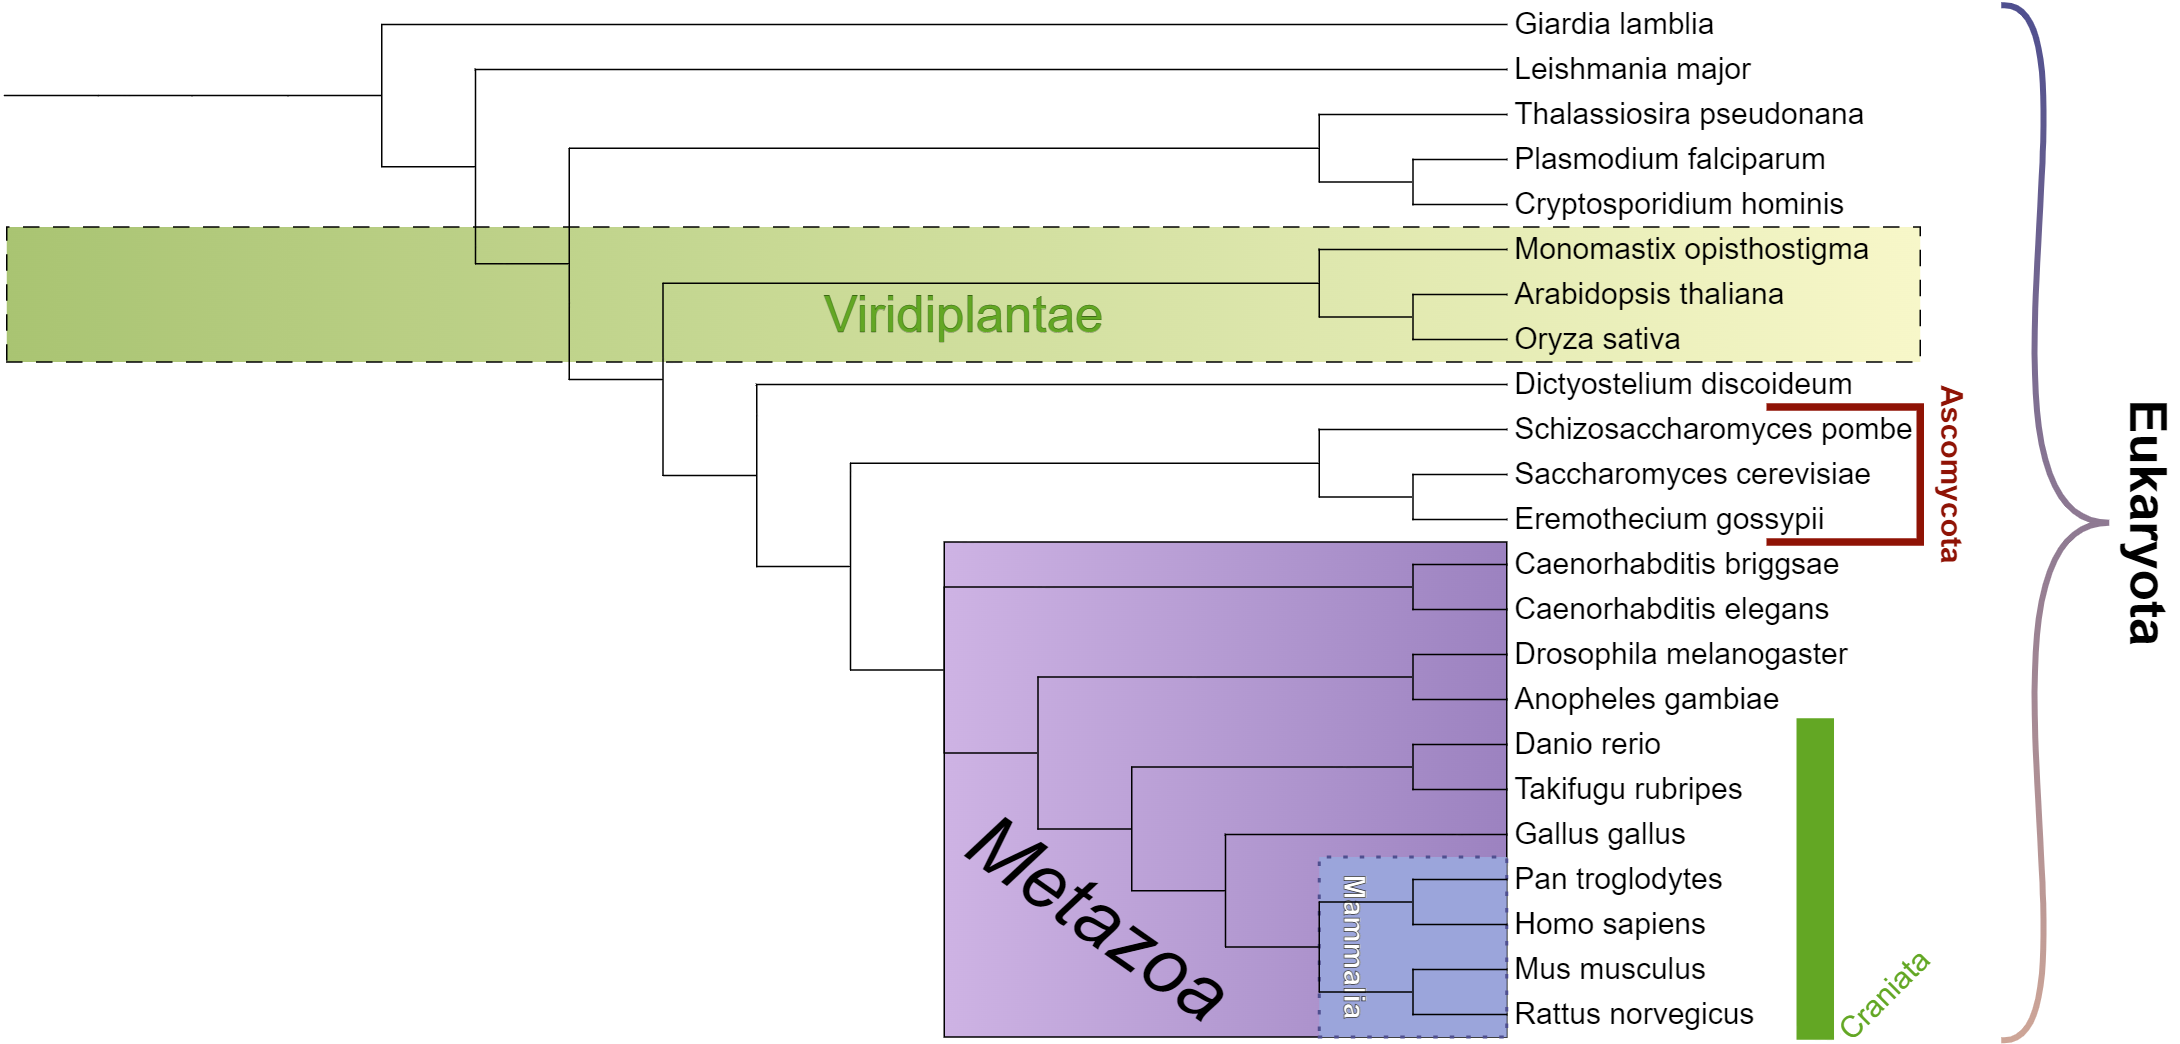
Automatic taxonomy assignment
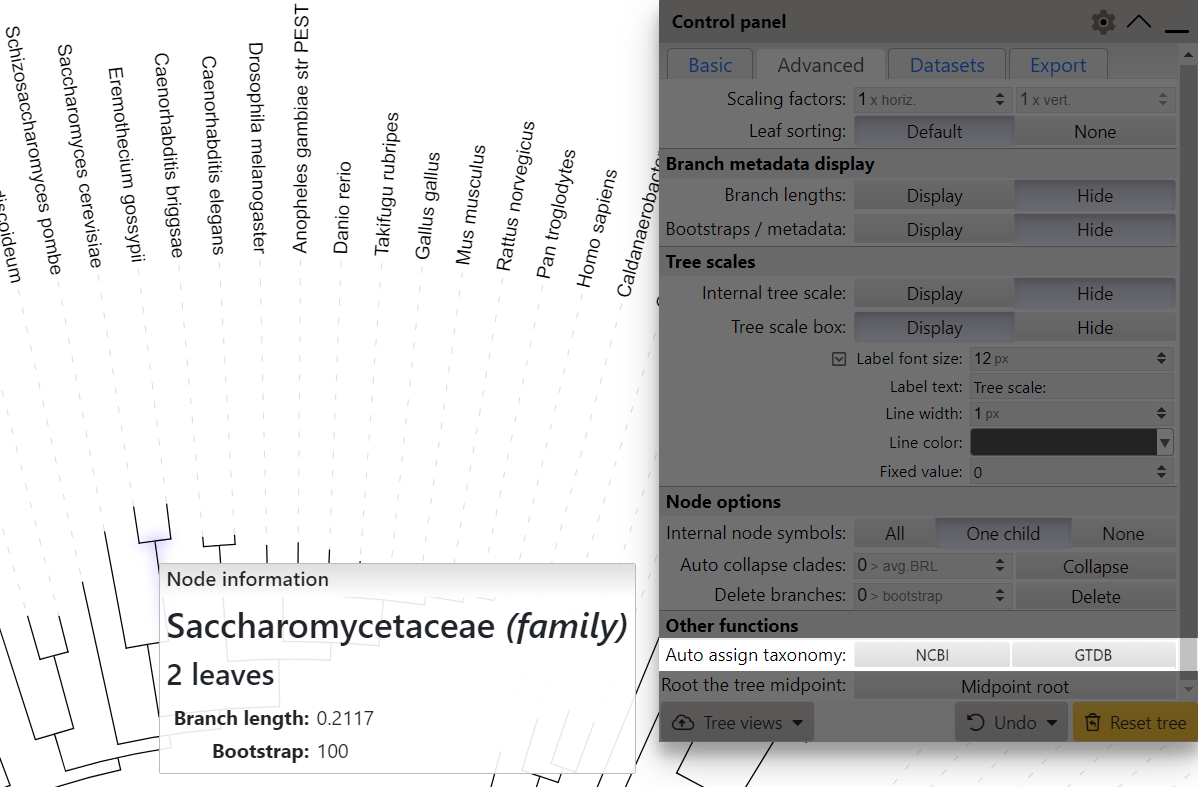
Automatic taxonomy assignment
Template file: auto_taxonomy.txt
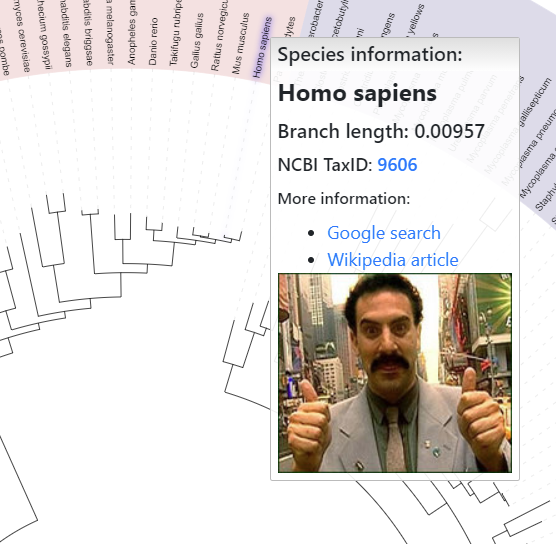
For phylogenetic trees whose leaf node identifiers correspond to NCBI taxonomy numeric IDs (e.g. 9606 for Homo sapiens) or GTDB accession numbers (e.g. GCF_001272835.1 for Mycoplasmoides pneumoniae), you can use the automatic taxonomy assignment function which is available on the Advanced tab of the control panel.
Alternatively, you can specify the taxonomy IDs for each leaf node using the auto_taxonomy.txt annotation file. When using the annotation file for the automatic taxonomy assignment, you can also define the format for the new leaf labels, by using the LABEL_FORMAT option.
The following steps will be performed:
- Leaf labels will become NCBI scientific names or GTDB species names corresponding to the original IDs (e.g. if your leaf node ID was 9606, the label will become Homo sapiens). When using the annotation file, the labels will be formatted according to the selected LABEL_FORMAT option.
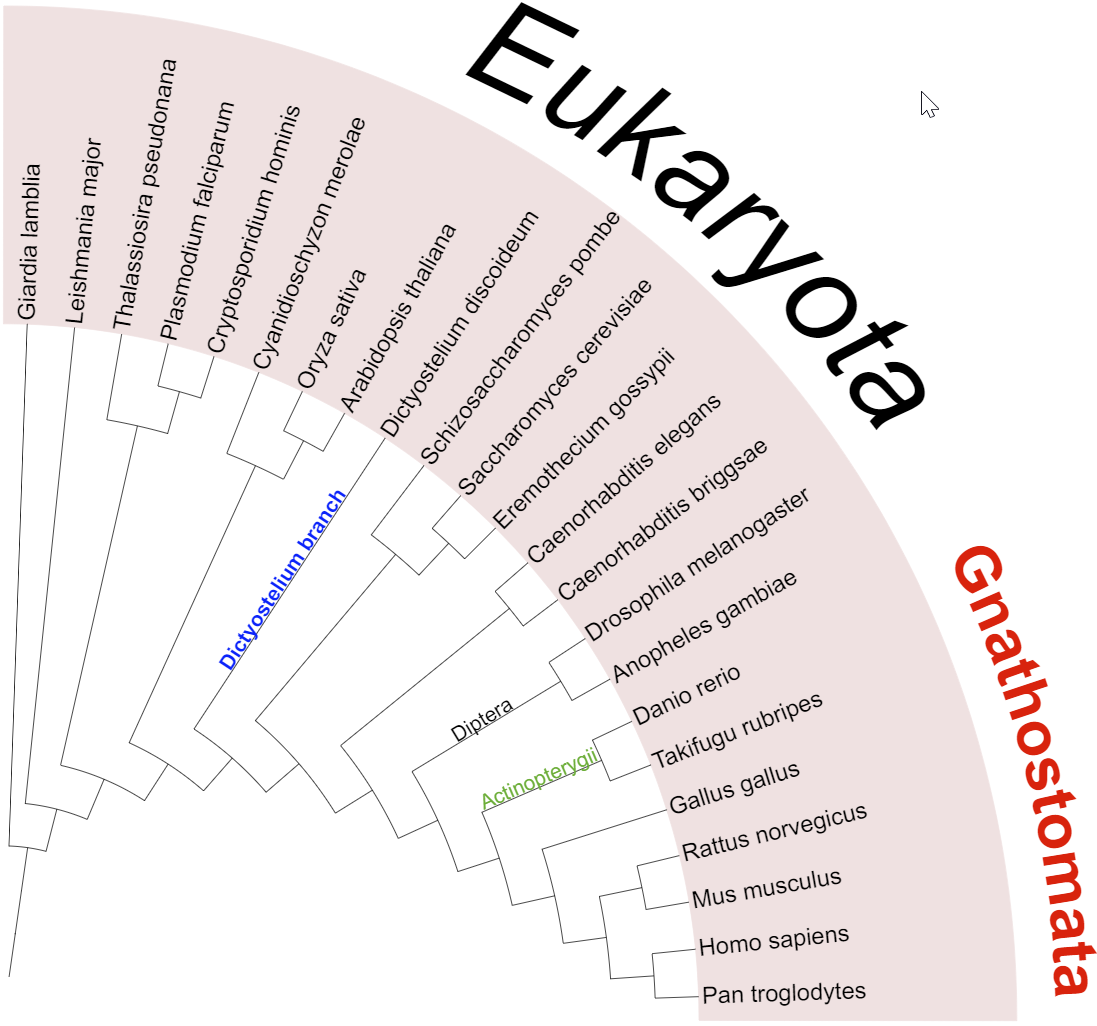
- All internal tree nodes will be assigned a NCBI/GTDB scientific name and taxonomic class/level, when possible. The highest possible taxonomic class to which all children belong will be used. If a matching class is not found (ie. children belong to different clades), the node will be marked as a subclade of the first matching lower taxonomic class/level. In the example on the right, Saccharomyces cerevisiae and Eremothecium gossypii belong to the same family (Saccharomycetaceae). If they were in the same genus, the highlighted internal node would be assigned to the genus level with its corresponding name.
Note that this function only updates the node labels. The original node identifiers still have to be used for any annotation assignments.
Working with tree views
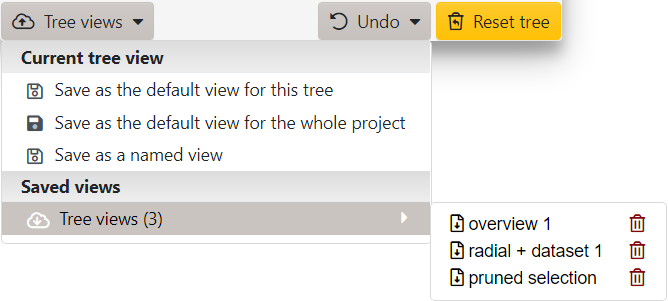
Working with tree views
To save a tree view, you must be logged into your iTOL account, and have an active subscription.
Click the button in the footer of the main control panel to access the functions related to tree views.
When saving a tree view in iTOL, the following information is stored:
- All options and settings from the Basic and Advanced tabs of the control panel
- Pruned nodes
- Current tree root (if the tree was re-rooted)
- Tree editing information (nodes rotated, moved or deleted)
- Collapsed clades
- Colored ranges display options
- Dataset visibility and order in the legend box
Note that the zoom level and the position of the tree on screen are not saved. The views can be saved in several ways:
- Default view for the tree: this view will be used whenever the tree is initially displayed, or the page refreshed. You can reset the default view back to iTOL defaults through the menu in the control panel footer.
- Default view for the whole project: this function will save the current tree view as a default for this and all other trees present in the same project in your user account. Settings will also be stored, and will automatically apply to any future trees uploaded to the same project. With project defaults, the following settings are NOT saved: re-rooting, collapsed clades, tree editing and pruning information.
- Named view: each tree can have an unlimited number of named views saved. These will be available through the Tree views submenu, and can also be accessed through the icon in the Views column in your user account.
Keyboard shortcuts

Keyboard shortcuts help
Several commonly used iTOL functions can be accessed directly via keyboard shortcuts. Hover the mouse cursor over the keyboard icon in the bottom left of the tree page to display the currently defined keys.
Individual keys can be customized or disabled through the keyboard shortcut editing panel, which is accessible via the control panel options menu (click the icon in the panel header).
General tree function keys can be used anywhere, while the node specific function keys work only while hovering the mouse cursor over a tree node. The following functions are available:
| Function | Default key |
|---|---|
| Node functions (while hovering) | |
| Collapse clade | c |
| Rotate clade | r |
| Prune node | p |
| Edit node label | l |
| New colored range | n |
| Add to colored range | b |
| Re-root at node | t |
| Tree functions | |
| Display: circular | 1 |
| Display: rectangular | 2 |
| Display: unrooted | 3 |
| Toggle panels | h |
| Midpoint root | m |
If you would find additional keyboard shortcuts useful, contact us.
Video tutorial Tree annotation
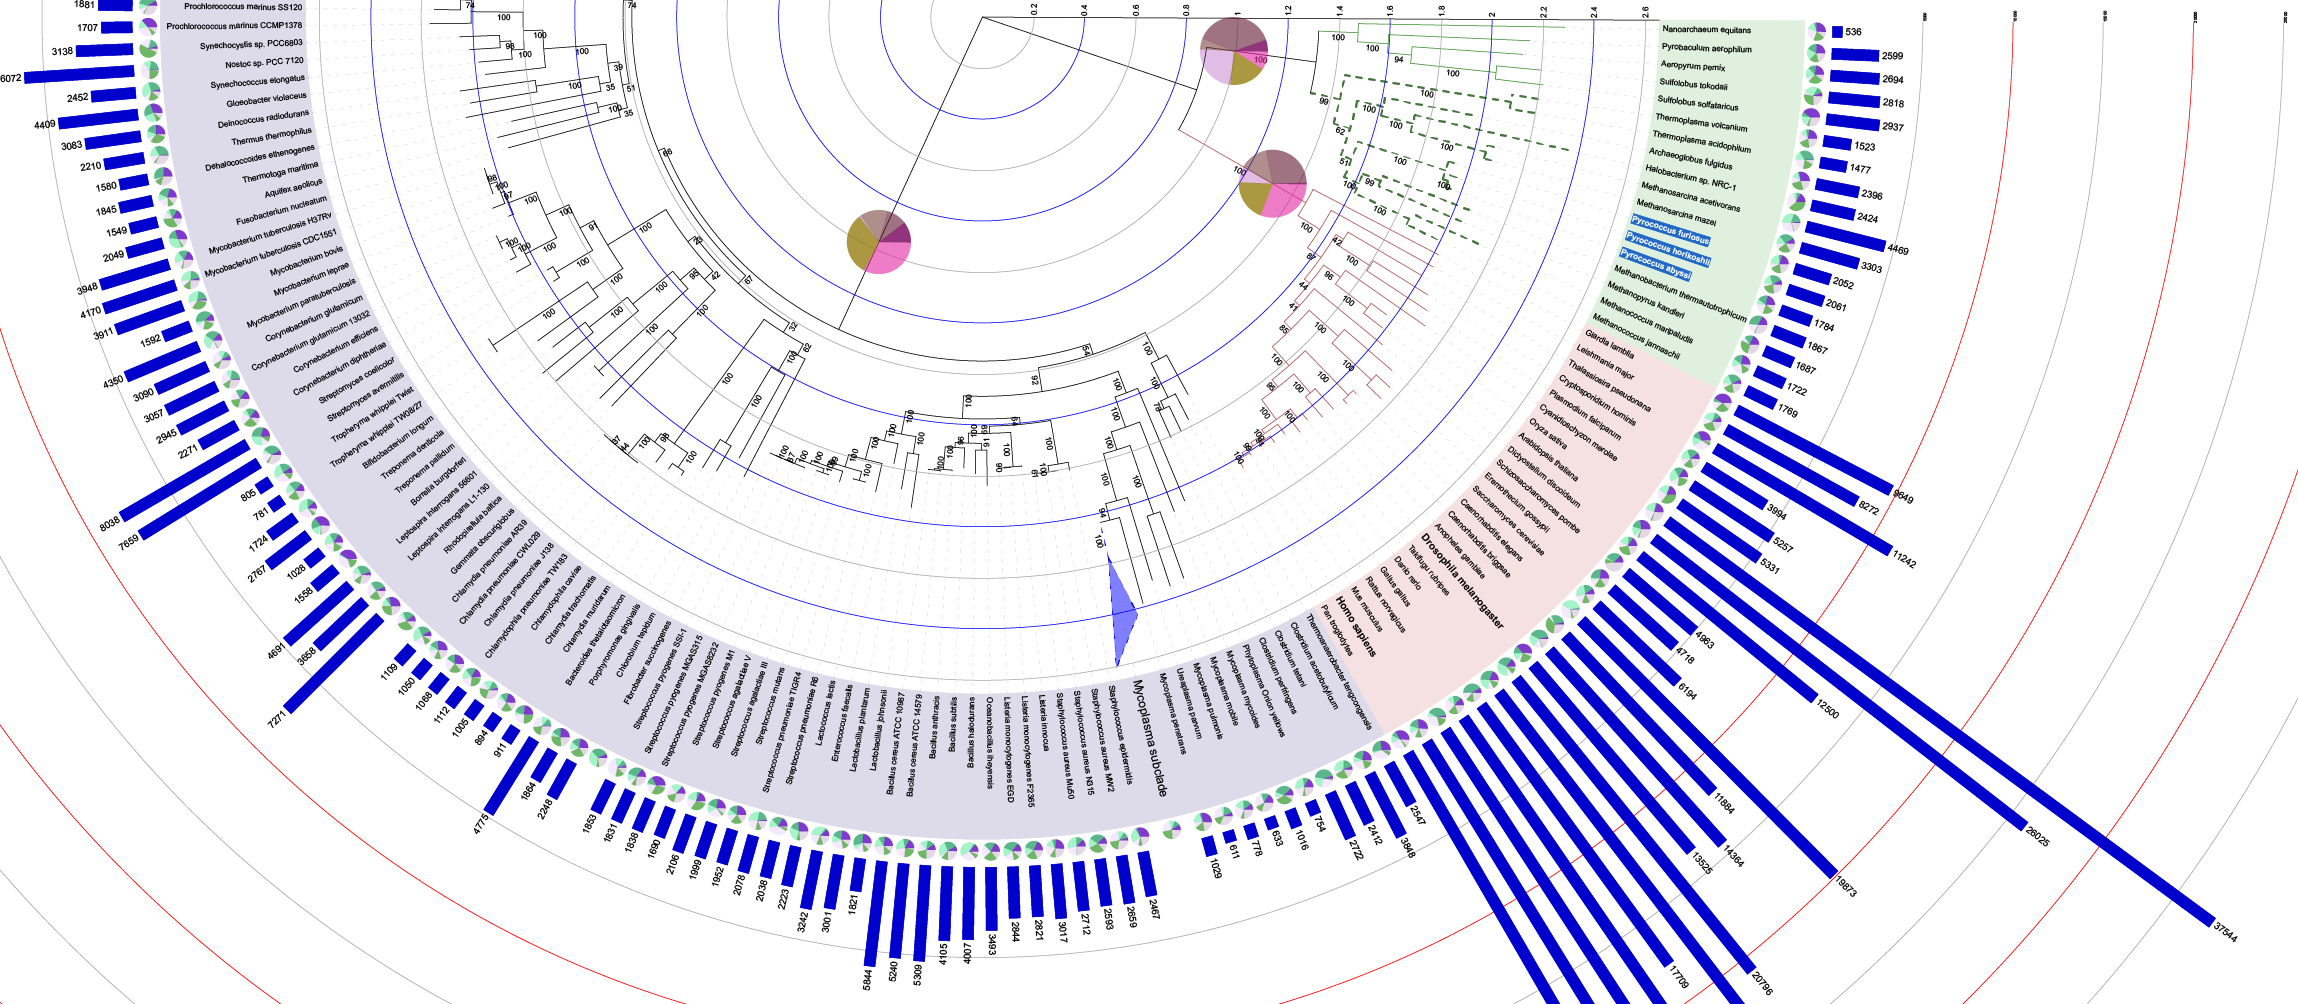
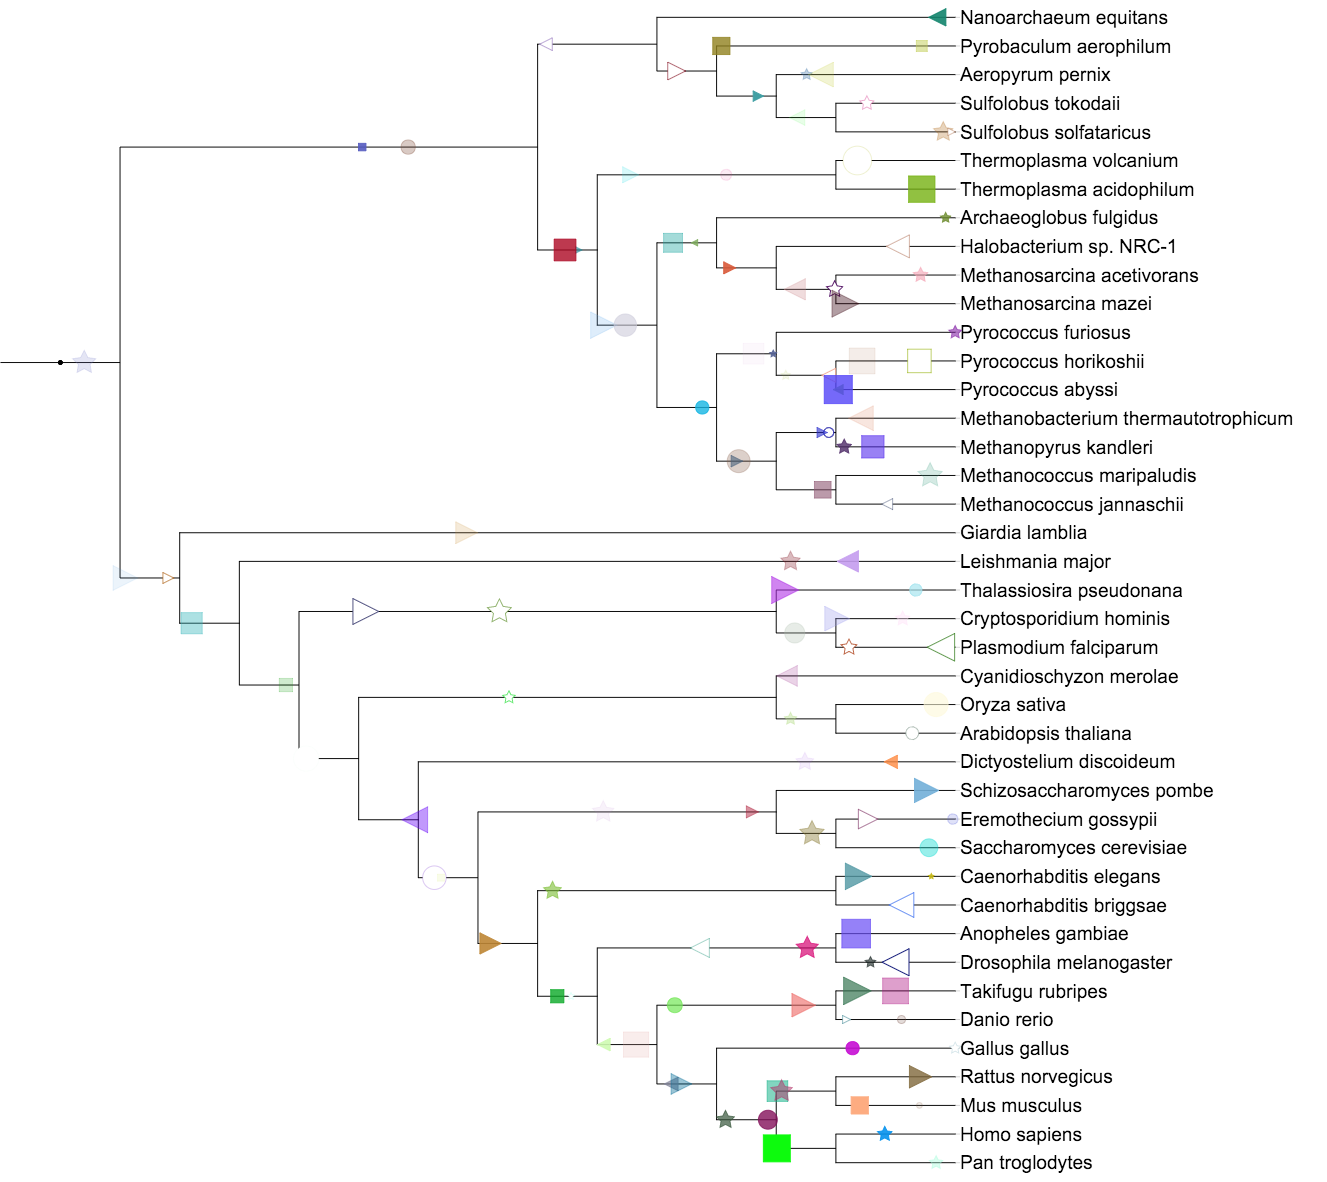
An example annotated tree
iTOL supports several types of tree annotation:
- changing the colors and styles of tree branches and labels
- defining colored ranges
- adding custom information to the mouseover popups
- basic drawing and labeling through manual annotation tools
- adding various types of datasets
The annotation can be done is various ways, depending on the annotation type:
- Interactive annotation: using the node functions menu to define the branch/label styles, or add new colored ranges. In addition, manual annotation tools provide a set of basic drawing/labeling tools.
- Annotation templates: download an annotation template file listed in the sections below, fill it with your data and simply drag and drop it onto the tree display, or upload it through the button in the "Datasets" tab of the control panel.
- Web dataset editor: several dataset types can be created and edited directly through the iTOL web interface. Simply click the button in the "Datasets" tab of the control panel to get started.
- iTOL annotation editor for spreadsheets: iTOL annotation editor is a tool providing direct connection to your iTOL account from Microsoft Excel, LibreOffice Calc or Google Sheets, and supports all commonly used tree annotation functions.
Saving annotation changes
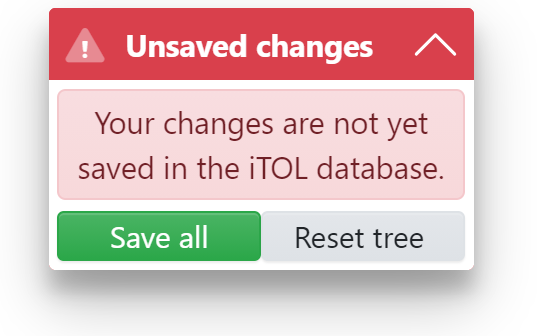
Unsaved changes warning dialog
To save annotations, you must be logged into your iTOL account, and have an active standard subscription.
Whenever any tree annotation is added or changed, a warning dialog shown on the right will be displayed.
If you want to commit your newly added or updated annotations, simply click the button. This will store all the annotation data into the iTOL database. If you do not save them, all changes will be lost when the tree page is reloaded, or the web browser closed.
If you do not wish to store the changes, or do not have an active subscription, simply export the tree figure before closing the page.
Annotation template files
Structure of an annotation template
iTOL supports tree annotation through the use of plain text files which are simply drag and dropped onto the tree display. You can drop multiple files at once, and they will be processed sequentially. In addition to the drag and drop, you can use the button on the Datasets tab of the control panel or in the header of the datasets legend box.
Template files for all available annotation types are available in the corresponding sections in this help page. You can also download a ZIP file with all available templates. All template files include comments and detailed instructions. If you have trouble understanding any of the template options, or encounter issues in annotating your trees, please contact the developer.
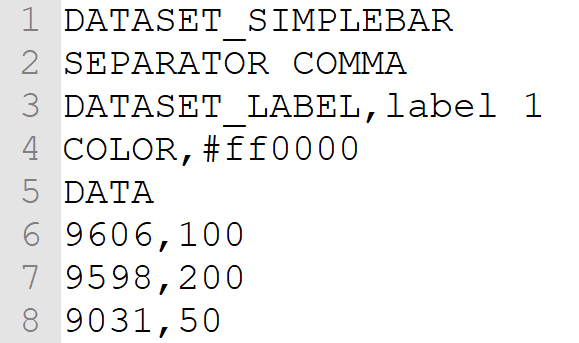
The image on the right shows a structure of an example annotation template. All lines in the file starting with a hash sign (#) are ignored. Annotation files start with an ID keyword (which identifies the annotation type) on line 1, followed by the SEPARATOR keyword on line 2. The selected separator (COMMA, SPACE or TAB) specifies which character is used to separate the fields in the file, and it has to be used throughout the file (ie. both in the options section, and to delimit the actual data). Most annotation files contain a few mandatory options (for example, DATASET_LABEL and COLOR) and a set of optional settings. Most settings can be later adjusted in the web interface through the 'Datasets' options tab of the control panel.
The actual data associated to each tree node is added below the DATA keyword (lines 6 - 8 in the image on the right).
We have prepared a ZIP archive (example_data.zip) which contains our Tree of Life (filename tree_of_life.tree.txt) and various example annotation files, filled mostly with random data. Try uploading the tree, and then dropping some of the annotation files onto it to get an idea how to prepare the annotations for your own trees.
iTOL also supports QIIME 2 QZA feature/annotation files, which can be dropped onto the trees uploaded through a QIIME 2 QZA file. See the QIIME section above for details.
Internal node identifiers
Defining internal nodes by using the last common ancestor method
When using annotation files to assign data to the internal tree nodes, there are two possibilities:
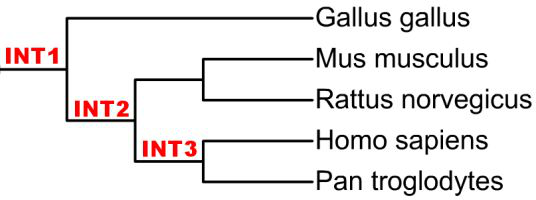
- Your tree already has internal node IDs present (as shown in the second example tree above): In this case, you can use these IDs directly in all annotation template files.
- There are no internal tree node IDs: You can specify the nodes using the Last common ancestor method. Select two leaves whose last common ancestor is the
node of interest, and use their IDs separated with three dashes ('---') or a vertical line ('|'). In the example on the right:
Gallus_gallus|Homo_sapiens   = node INT1
Mus_musculus---Homo_sapiens  = node INT2
Pan_troglodytes|Homo_sapiens = node INT3
In the example above, to add an annotation to the node INT1, you would specify Gallus_gallus|Homo_sapiens as the node ID in the annotation file.
Depending on the dataset type, values associated to internal nodes will only be visible when the node is collapsed. However, such dataset types have an additional option "Display internal node values" (field SHOW_INTERNAL in the annotation file), which can force the display of internal node values even when these are not collapsed. Note that this could result in overlapping displays, if there are values for the leaf nodes present as well.
Matching multiple identifiers
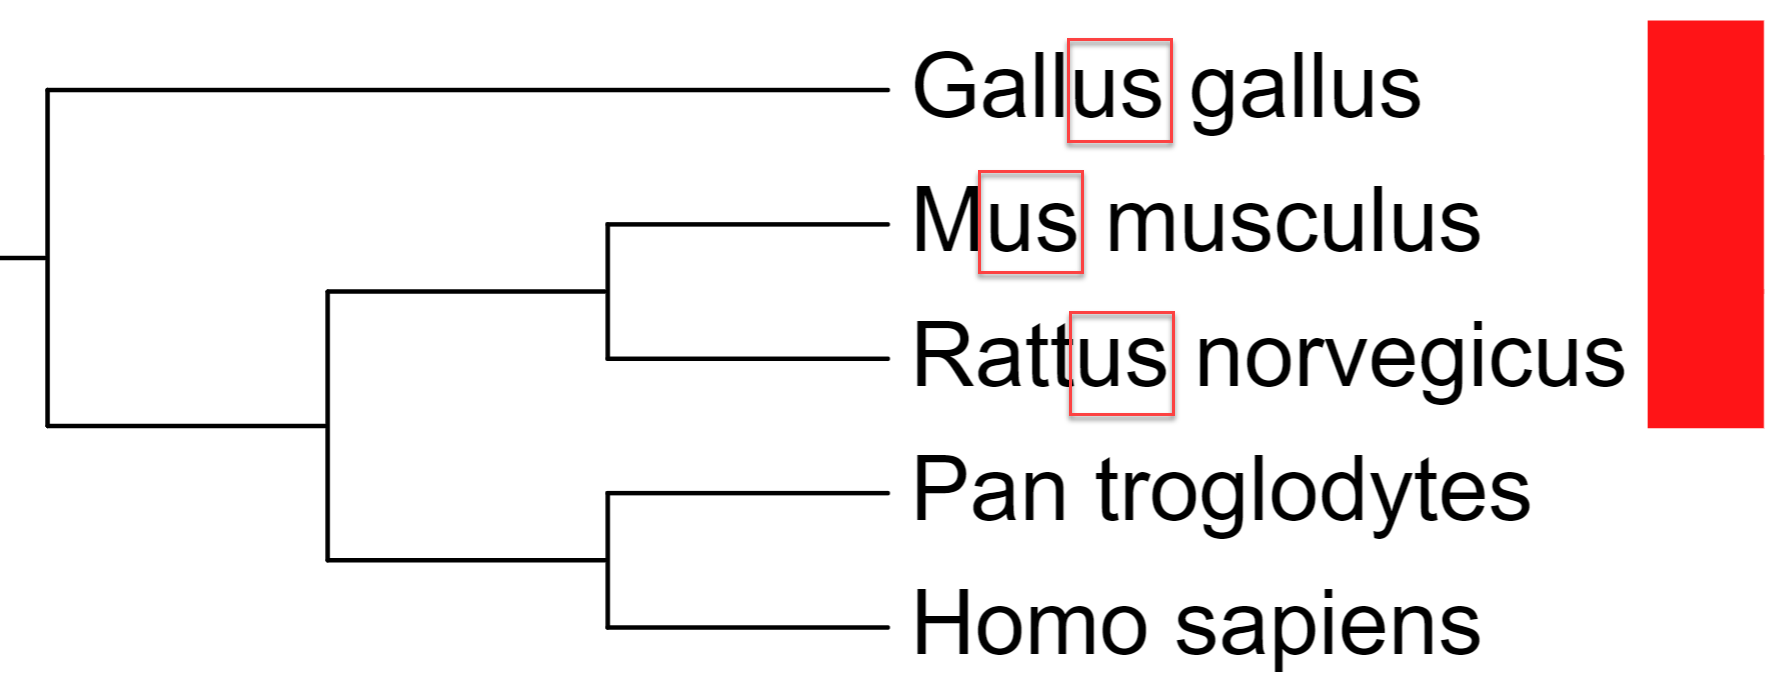
Matching multiple IDs in an annotation file
In addition to direct node ID matching, it is possible to assign a single annotation value to multiple nodes simultaneously.
To match multiple nodes, replace the node ID value in the annotation file with the keyword CONTAINS==, followed by the text to be matched. All node IDs which contain this text will be assigned the annotation specified.
Here is an example colored strip dataset:
DATASET_COLORSTRIP
SEPARATOR COMMA
DATASET_LABEL,multi ID matching example
COLOR,#00ff00
DATA
CONTAINS==us,#ff0000
In the example above, all node IDs which contain the text 'us' (due to the 'CONTAINS==us' definition) are assigned a red colored strip ('#ff0000').
This function is available in the following annotation file types: TREE_COLORS, Colored/labeled ranges, Branch and label styles dataset, Colored strip dataset, Branch/external symbols dataset and Text labels dataset. If you would find this feature useful in some other dataset type, please contact the developer.
Note for advanced users: the matching is performed using a Javascript RegExp, so any standard RegExp pattern/special character can be used in the text.
Changing leaf labels and setting internal node names and classes
Template file: labels_template.txt
Supported by the iTOL annotation editor for spreadsheets

Internal node with defined name and class
To quickly change the text assigned to the leaf nodes, or to assign/change names for the internal tree nodes, use the LABELS annotation file. Label text can also be changed interactively through the node functions menu, by using the Edit label button from the Labels submenu.
Note that this function only changes the actual text of the labels, you will still need to use the original tree node IDs in any other annotation files.
In addition to the name/label, you can specify a custom class for internal tree nodes. Class can be any custom text value, and will be displayed in the node information popup together with the name ('genus' in the figure on the right).
More importantly, internal node classes can be used to automatically collapse clades.
Bulk label editing
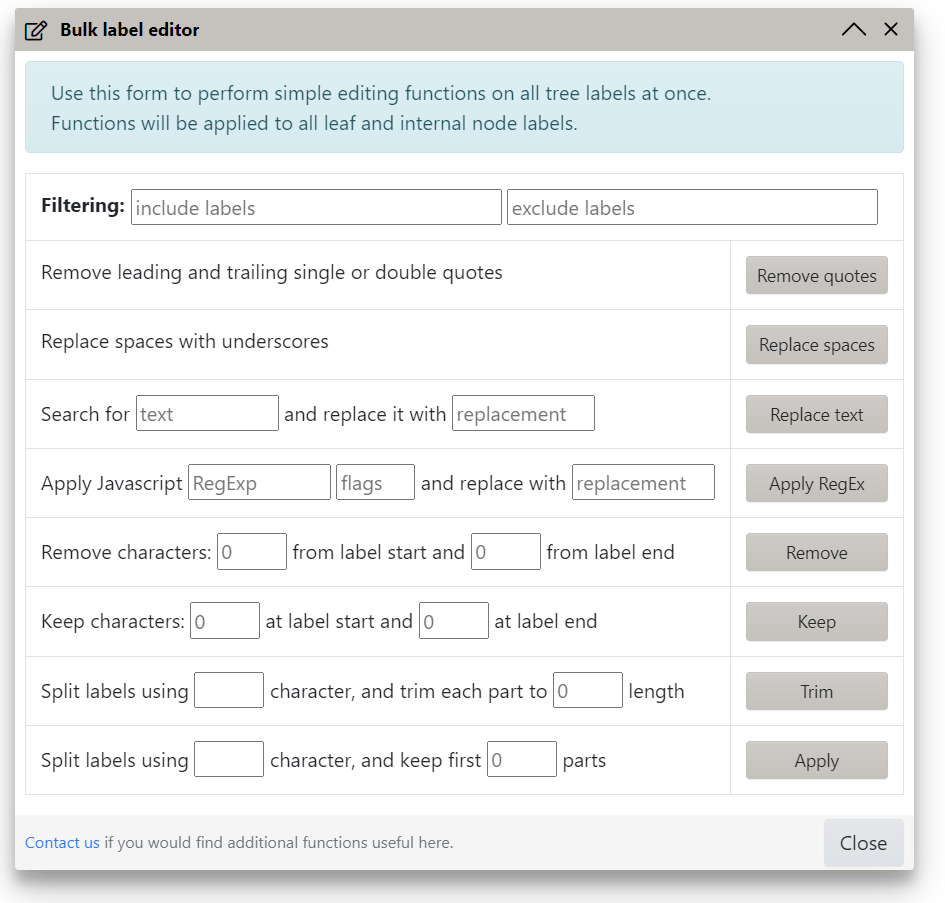
Tree labels bulk editing functions
Use the Bulk edit button in the Other functions section of the advanced control panel tab to access several convenience functions. These will be applied to all leaf and internal labels at once, unless the filtering options are used. You can include or exclude labels containing any text by using the corresponding fields in the Filtering section.
The following functions are available:
- Replace leading or trailing single or double quotes
- Replace all spaces with underscores
- Simple search and replace text function
- Apply a Javascript regular expression and replace matches
- Remove a set number of characters from label start or end
- Keep a set number of characters from label start or end
- Split label into parts/words, and trim each part to a set length
- Split label into parts/words, and keep a set number of parts/words
Defining multiple font styles within labels
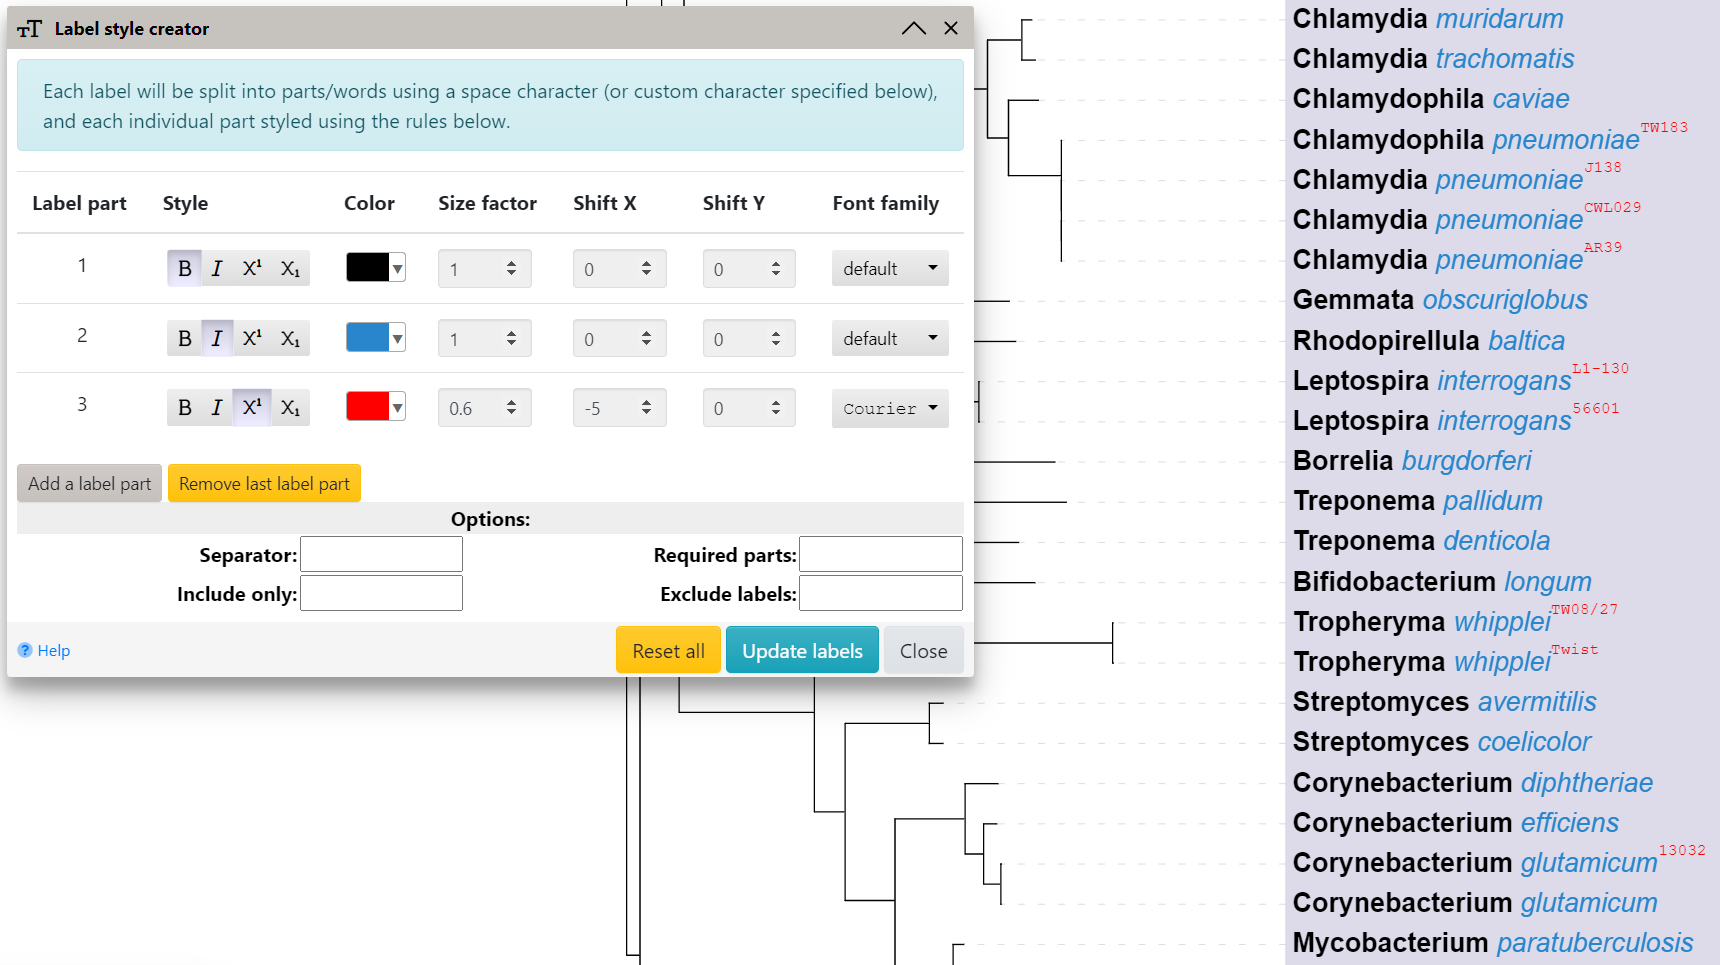
Using the label style creator
Defining multiple font styles for a single label
Template file: label_multistyle.txt
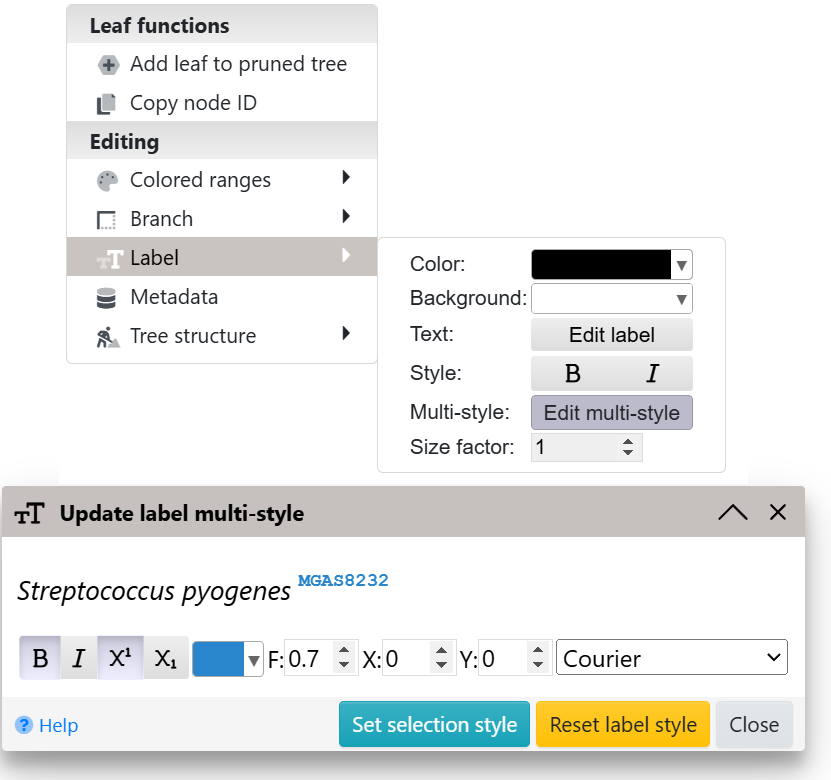
Mixing multiple different styles (e.g. one word bold and another one italic) within regular tree labels can be accomplished in several ways:
- individual labels: use the Edit multi-style function in the Label part of the node functions menu
- all labels at once: by using the multi-style annotation template, or through the label style creator, which can be accessed via the Multi-styles button in the Other functions section of the advanced control panel tab
Using the label style creator
Each tree label will be split into parts using a separator character provided (space by default), and style rules defined will be applied to each part.
By default, the rules will be applied to all labels in the tree. Use the filtering options to select a subsets of labels, and apply different styles to them:
- Required parts: only labels which contain the specified number of parts will be styled
- Include only: only labels which contain the specified text will be styled
- Exclude labels: labels which contain the specified text will not be styled
Example leaf label:

Staphylococcus aureus Mu50

would be split into 3 parts:

1. Staphylococcus
2. aureus
3. Mu50
Separate style can be defined for each label part, consisting of the following attributes:
- bold, italic or bold-italic
- superscript or subscript
- color
- size factor
- shift X and Y, for fine-tuning of the position of the part
- font family
Use the Reset all button to remove all style definitions back to default.
Note that any label text changes (for example, by using the LABELS annotation file, or through the iTOL annotation editor) are not automatically propagated to the multi-style labels. After updating the label text, you will have to re-apply the styles.
Defining node popup information
Custom HTML displayed in a node popup
Template file: popup_info_template.txt
If you want to display additional information in the popup windows which appear when hovering mouse pointer over tree nodes or labels, you can use the POPUP_INFO annotation file.
For each tree node ID, you can define both the popup title and the content. Content can be plain text or any valid HTML (including links to external web sites, or IMG tags pointing to external images).
Embedding external videos or other media is possible as well, here is an example tree with embedded Youtube videos.
If you encounter problems with the popup display please contact the developer.
Manual annotation and drawing tools (legacy)
Please note that manual annoations have been superseded by the Manual annoation datasets. There can now be multiple sets of manual annotations, which can be displayed or hidden as required.
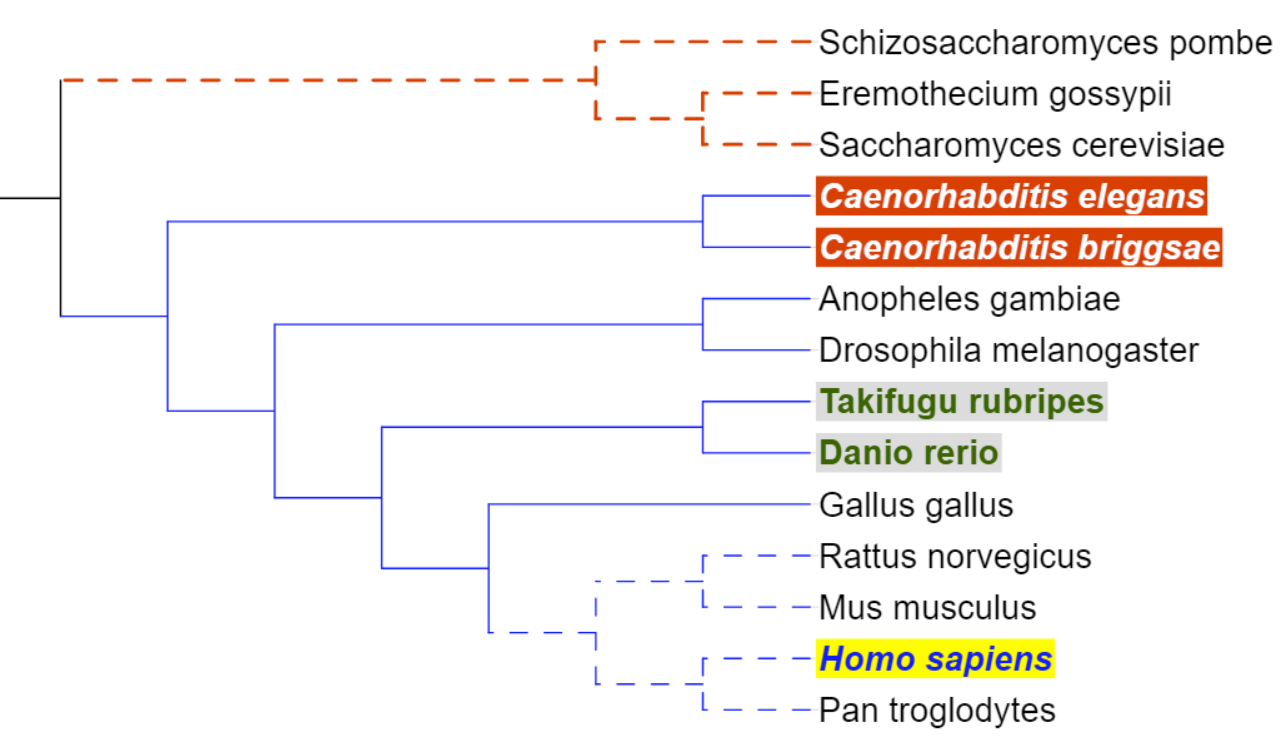
Branch and label colors and styles
Template file: colors_styles_template.txt
Supported by the iTOL annotation editor for spreadsheets
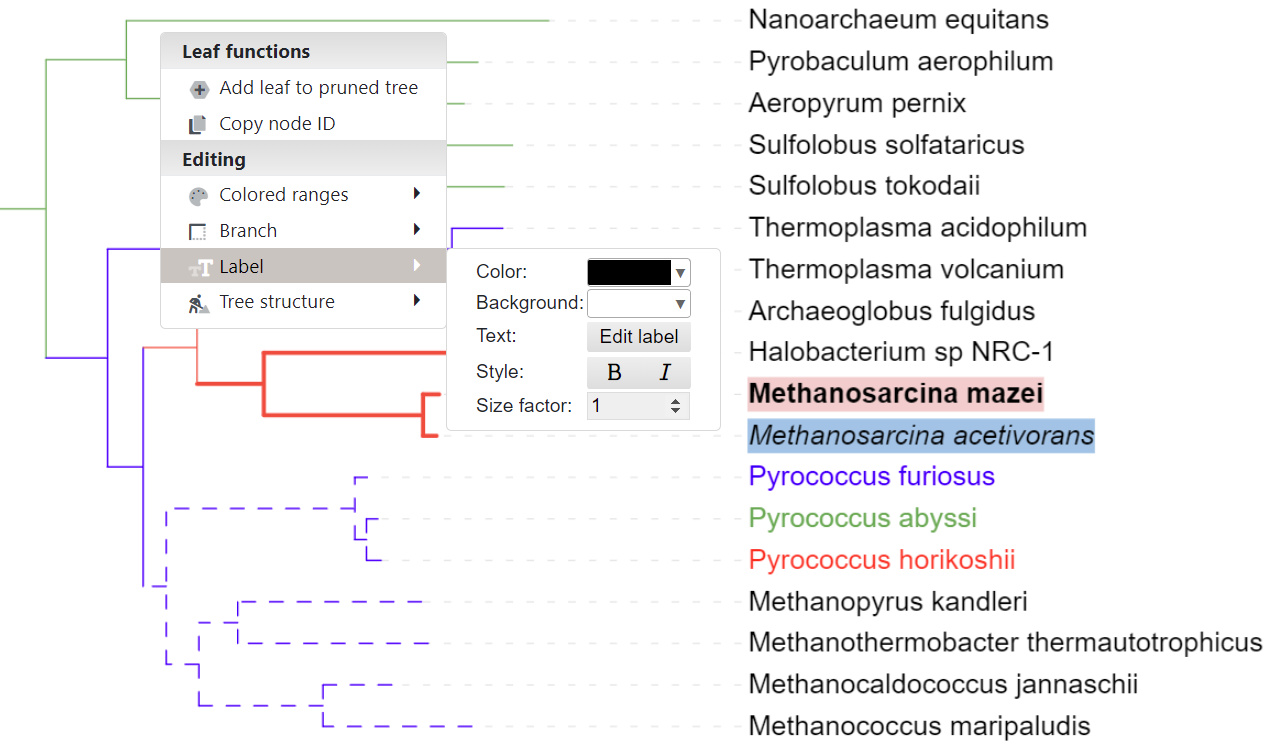
Interactively defining colors and styles
Colors and styles for the tree branches and leaf labels can be set by using the TREE_COLORS annotation file, or interactively through the node functions menu. Simply click on any node or label, and select the desired function from the 'Editing' section of the popup menu.
By using the TREE_COLORS annotation file, you can define the colors, styles and widths/sizes for each individual node or label in the tree. To assign styles to the internal tree nodes, check the relevant section above.
In addition to setting the label text color, a separate background color can be specified for each label.
Note that most of the TREE_COLORS functionality is also available through the Branch/label styles dataset, which allows multiple color styles to be defined (by using several separate styles datasets). TREE_COLORS annotation should be used for static, permanent style annotations.
Additionally, when uploading phyloXML formatted trees, branch colors and width factors will be parsed from the corresponding phyloXML annotations, if these are present (<color> and <width> within <clade> elements). Note that the colors must be specified via <red>,<green>,<blue> and <alpha> elements, as per the phyloXML schema.
Branches with color gradient lines
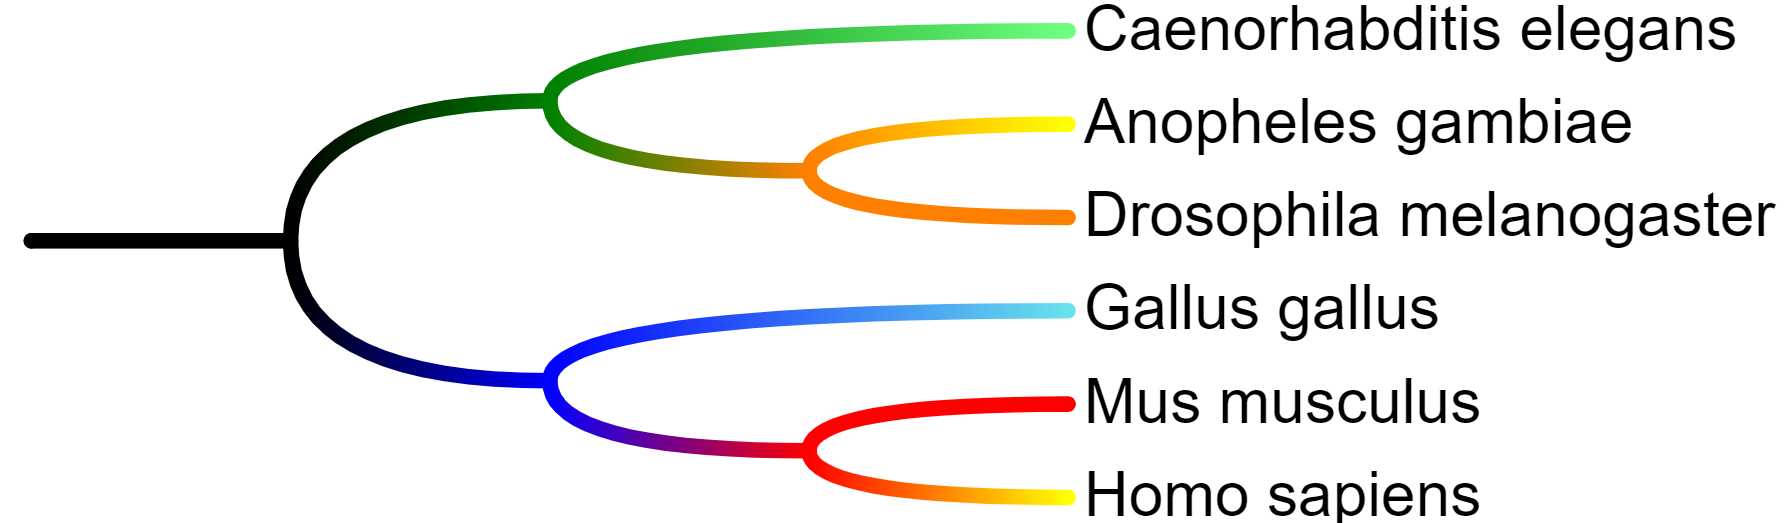
Branches with color gradient lines
When the Color gradient option on the Basic tab of the control panel is set to On, branch lines will be colored with a gradient starting from the ancestor node color towards the actual node color.
This feature can be used regardless of the source of branch colors (metadata based coloring, TREE_COLORS annotation file, Branch styles dataset or direct interactive color settings).
Colored ranges (legacy)
Template file: colors_styles_template.txt
Supported by the iTOL annotation editor for spreadsheets
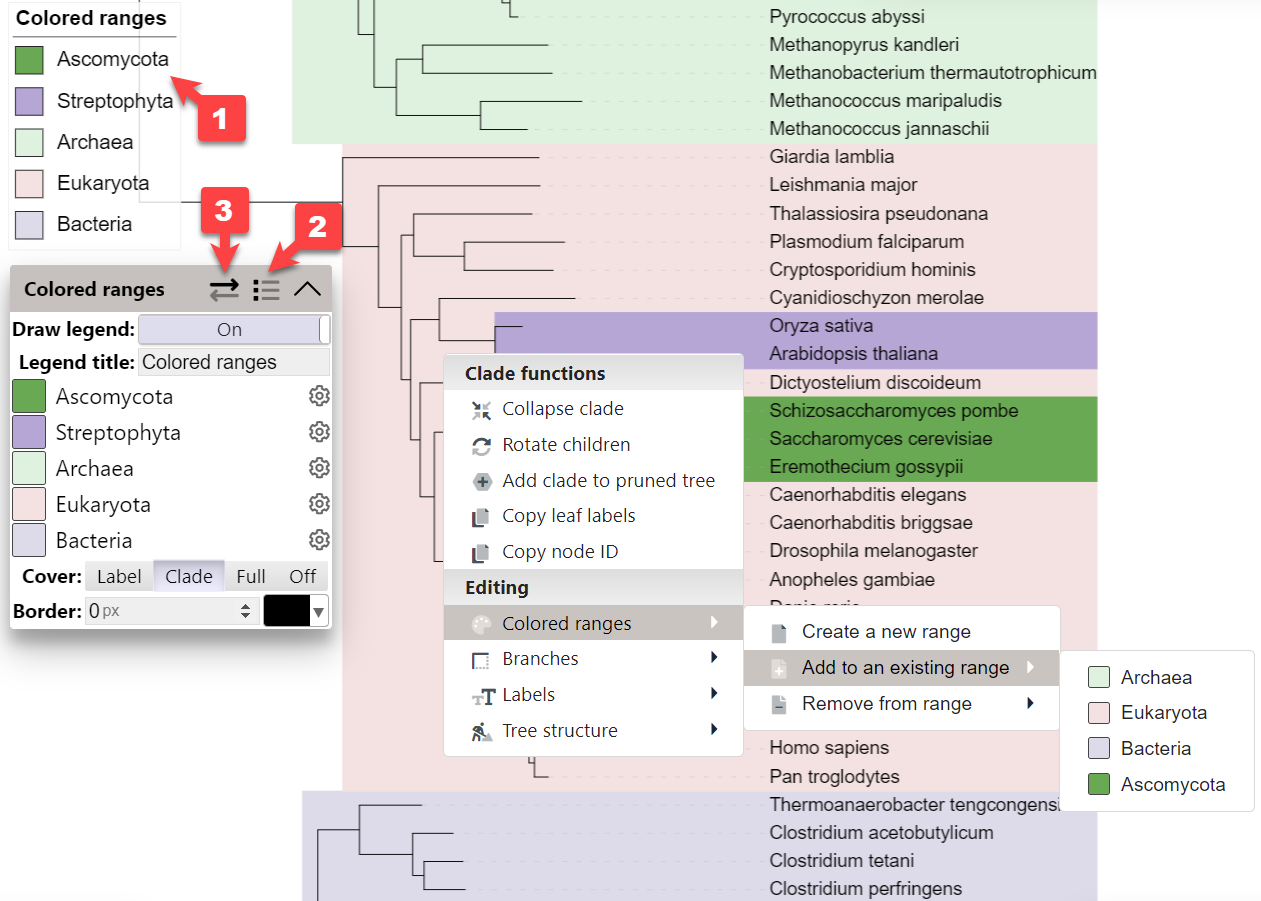
Working with colored ranges (legacy)
Please note that colored ranges have been superseded by the Colored/labeled ranges datasets, which provide many additional features. You can convert your existing legacy colored ranges to a dataset by clicking the button (3) in the colored ranges legend header.
Colored ranges provide a simple means of highlighting a set of tree leaf nodes or clades. Use the buttons in the colored ranges legend box to switch between the coverage modes:
- Label : color ranges will cover only the leaf labels. Note that the label position must be set to Aligned in the Basic control panel tab.
- Clade : color ranges will cover the complete clade branches. Note that the ranges should be properly assigned to the clade internal IDs, and not composed of individual ranges assigned to the leaf node IDs
- Complete : color ranges will extend all the way to the tree root
Colored ranges can be defined by using the TREE_COLORS annotation file, or interactively through the node functions menu. Simply click on any node or label, and select the desired function from the 'Colored ranges' submenu. You can simply create new colored ranges or add nodes to existing ones.
By using the TREE_COLORS annotation file, you can define a large number of colored ranges without the need to use the interactive mode. Check the template file for details and instructions. To assign ranges to internal tree nodes, check the relevant section above.
If you need the colored ranges legend 1 in the exported tree figures, click the icon in the ranges function box header 2, and set the Draw legend option to On. Note that the colored ranges legend is sortable. Simply click a range label in the colored ranges function box, and drag the range to a new position.
Video tutorial Datasets
Datasets legend box and an example controls tab
iTOL can annotate trees with several types of datasets, described in detail below. Datasets can be created in several ways:
- by using annotation template files
- through the web dataset editor
- directly from Microsoft Excel, LibreOffice Calc or Google Sheets by using the iTOL annotation editor for spreadsheets
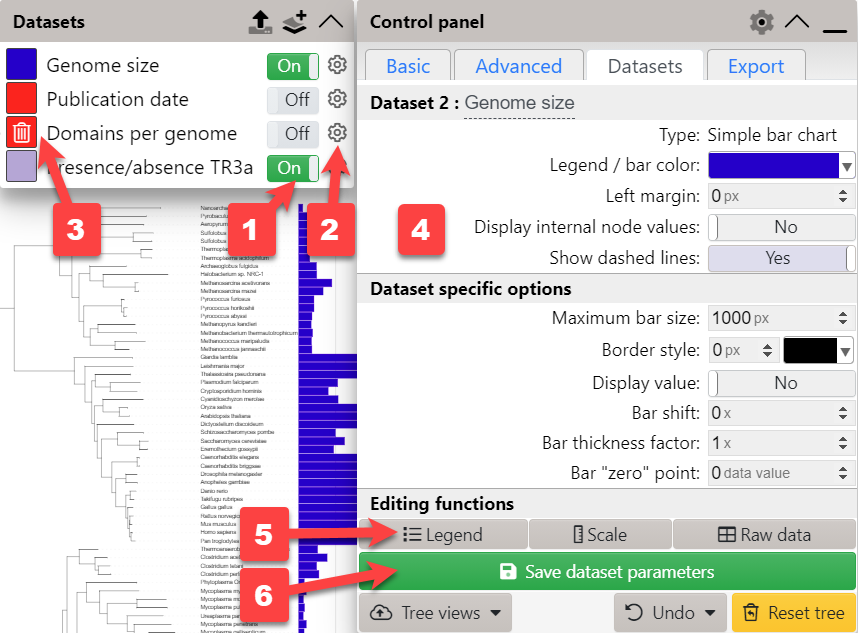
The display of each dataset is controlled through the toggle button ( 1 ) next to each dataset label in the legend box.
Access the dataset options ( 4 ) by clicking the corresponding gear icon ( 2 ) in the legend box. Dataset options can also be quickly accessed by double clicking any dataset element in the tree display.
To delete a dataset, hover over its label in the legend box and a click the trashcan icon that appears ( 3 ).
The order of the datasets in the legend box can be changed by dragging the individual rows. The order is saved with tree views, or when saving the default tree view.
The number of datasets is limited only by the available memory, and they can all be displayed simultaneously. Datasets are displayed in the order they are switched on. You can adjust the dataset position by changing its Left margin option, which can be positive or negative.
Depending on the dataset type, use the buttons in the Editing functions section ( 5 ) to edit the dataset legend, scale or the data itself.
After changing any of the available dataset options, you can save the parameter changes ( 6 ) in the iTOL database. Note that this function requires an active standard subscription.
Video tutorial Dataset groups
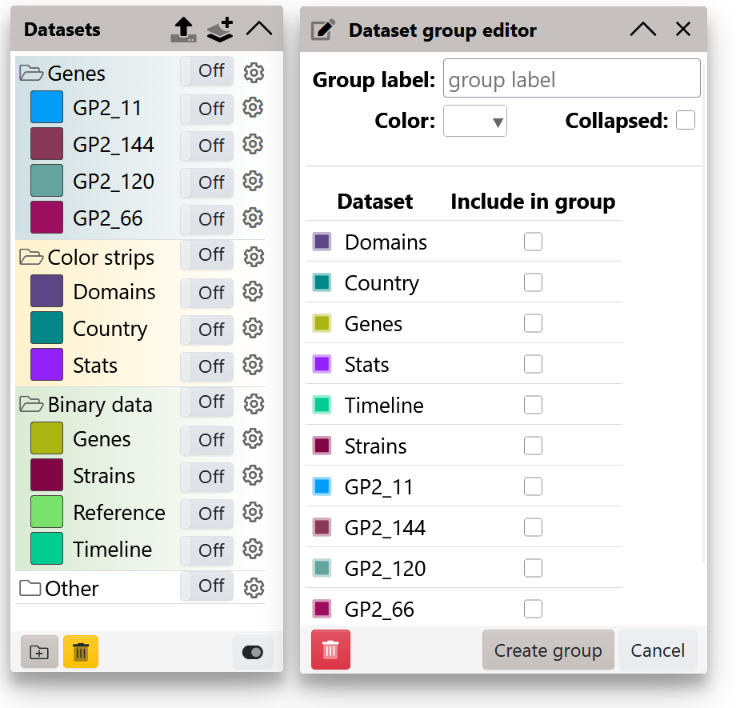
Working with dataset groups
If your tree contains many datasets, it can be helpful to organise them into groups. Simply click the button in the footer of the datasets legend panel to define a new group, and add datasets to it.
Dataset groups can be highlighted with different background colors, and can be collapsed by clicking the folder icons or double clicking the group headers. You can drag the datasets into different groups, and the groups themselves can be reordered by dragging them around.
Use the On/Off icons in the group headers to automatically toggle all its datasets.
Click the to remove the groupings. This will not affect the datasets, it will only ungroup them all.
To save your dataset group definitions, use the tree views functionality to save them into the default tree view, or as a named view. When using named views, you can define different dataset groupings in each view.
Web dataset editor
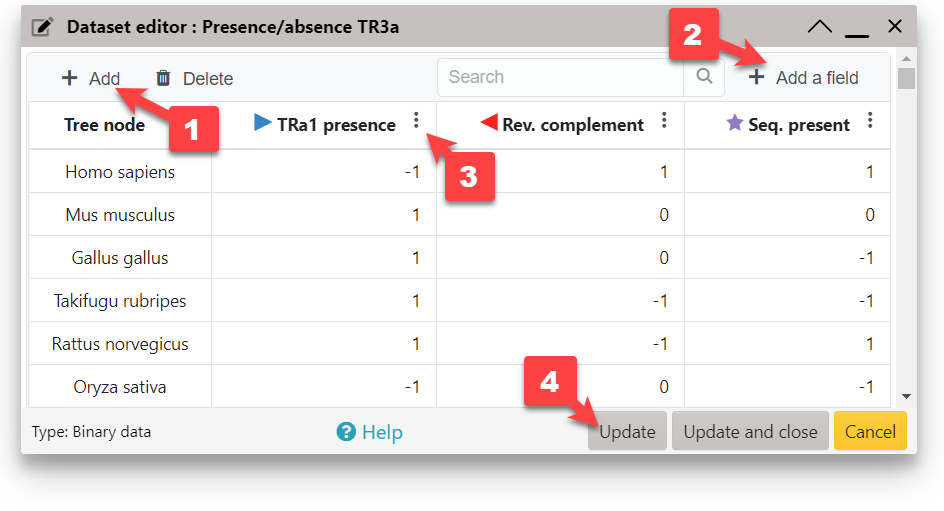
Web dataset editor interface
Some dataset types can be created or edited directly in through the iTOL web interface. Simply click the button in the 'Datasets' tab of the control panel or the icon in the datasets legend box.
Existing datasets, even if created from template files, can be edited at any time. Simply click the button in the Editing functions section of the dataset options.
The web dataset editor is suitable for simple datasets and smaller trees. For large amounts of data, please use annotation templates or the iTOL annotation editor for spreadsheets.
To add a new row, click the Add button ( 1 ). Double click any cell to edit it. Tree node column will provide an auto-complete popup showing the matching tree IDs. You can add values to internal nodes which do not have IDs assigned by using the last common ancestor method.
When working with dataset types which support multiple value fields for each node (e.g. Multi value bar charts, Pie charts or Binary datasets), click the Add a field button ( 2 ) to define additional fields. Existing fields can be edited through the column option menu ( 3 ). Click and drag the column headers to change the field order.
To visualize your entered data, click the button ( 4 ). This will update the display, and keep the editor open. button will close the editor after updating the display.
Once the editing is complete, you can optionally save the dataset into the iTOL database.
iTOL annotation editor for spreadsheets
iTOL annotation editor for spreadsheets
Full access to the iTOL annotation editor requires an active editor subscription.
The most convenient way of creating and editing datasets and other tree annotations is through the iTOL annotation editor for spreadsheets. It offers full access to your iTOL account though the familiar spreadsheet user interface of Microsoft Excel, LibreOffice Calc or Google Sheets. The following annotation functions are supported by the editor:
- Editing of tree node labels
- Editing of node metadata
- Creation and editing of colored ranges
- Creation and editing of datasets, with support for most popular types
- Error reporting directly in the spreadsheet user interface, with dynamic highlighting of cells with invalid data
More information with detailed help and a tutorial video is available on the iTOL annotation editor web site.
If you encounter any problems with the editor, please contact us.
Dataset legends
LEGEND_TITLE,Example legend
LEGEND_SHAPES,1,1,3,2,OC
LEGEND_COLORS,#ff0000,#0000ff,#00ff00,#8e7cc3,#ffff00
LEGEND_LABELS,value1,value2,value3,value4,value5
LEGEND_SHAPE_SCALES,1,0.5,1,1,1
LEGEND_SHAPE_INVERT,1,0,0,0,0
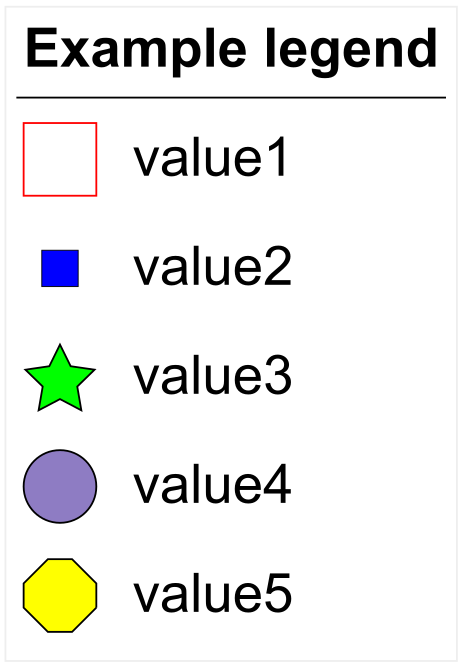
An example dataset legend
All datasets in iTOL can have an individual dataset legend, which will be displayed only when the dataset is visible, and will also be included in the exported tree figures.
When using dataset annotation files, the legend is defined using the fields LEGEND_TITLE, LEGEND_SHAPES, LEGEND_COLORS and LEGEND_LABELS.
Optionally, you can set the sizes of individual shapes by using the LEGEND_SHAPE_SCALES field. For each shape, set a scale from 0 to 1.
Using the LEGEND_SHAPE_INVERT field, you can invert each shape, so that its border color corresponds to the selected color, and there is no fill.
Legends can also be created or edited interactively by clicking the button in the Editing functions section of the dataset options. You can also double click any displayed legend to directly open the legend editor. When using the interactive legend editor, click the button to populate the fields automatically from the dataset information.
By default, legends will be automatically positioned one below the other on the left side of the tree. You can click and drag any legend to change its position, or use the LEGEND_POSITION_X and LEGEND_POSITION_Y values in the annotation file to set the legend position.
Individual legend entries are displayed vertically below each other. To order them horizontally instead, you can set the LEGEND_HORIZONTAL value to 1.
To increase or decrease the size of the whole legend, use the LEGEND_SCALE parameter. If you do not want to visualize the legend, but still want to have it defined, set the LEGEND_VISIBLE parameter to zero. Visiblity can be later toggled through the interactive legend editor.
When displaying legends of various color gradients, you can set the LEGEND_GRADIENT value to 1, and use the square shape for all fields. This will disable the shape borders, and display them without spacing.
LEGEND_SHAPES are defined with a number between 1 and 12, or with any domain shape code (e.g OC for the value 5 in the example on the right):
| 1 | square | |
| 2 | circle | |
| 3 | star | |
| 4 | right triangle | |
| 5 | left triangle | |
| 6 | checkmark | |
| 7 | solid line | |
| 8 | dashed line | |
| 9 | dotted line | |
| 10 | arrow left | |
| 11 | arrow right | |
| 12 | bidirectional arrow |
Dataset scales
Dataset scales
Several dataset types support the display of custom scales: Simple bar chart, Multi value bar chart, Boxplot, Protein domains and MEME motifs. When using dataset annotation files, scales are defined through the DATASET_SCALE field.
Scales can also be created or edited by clicking the button in the Editing functions section of the dataset options.
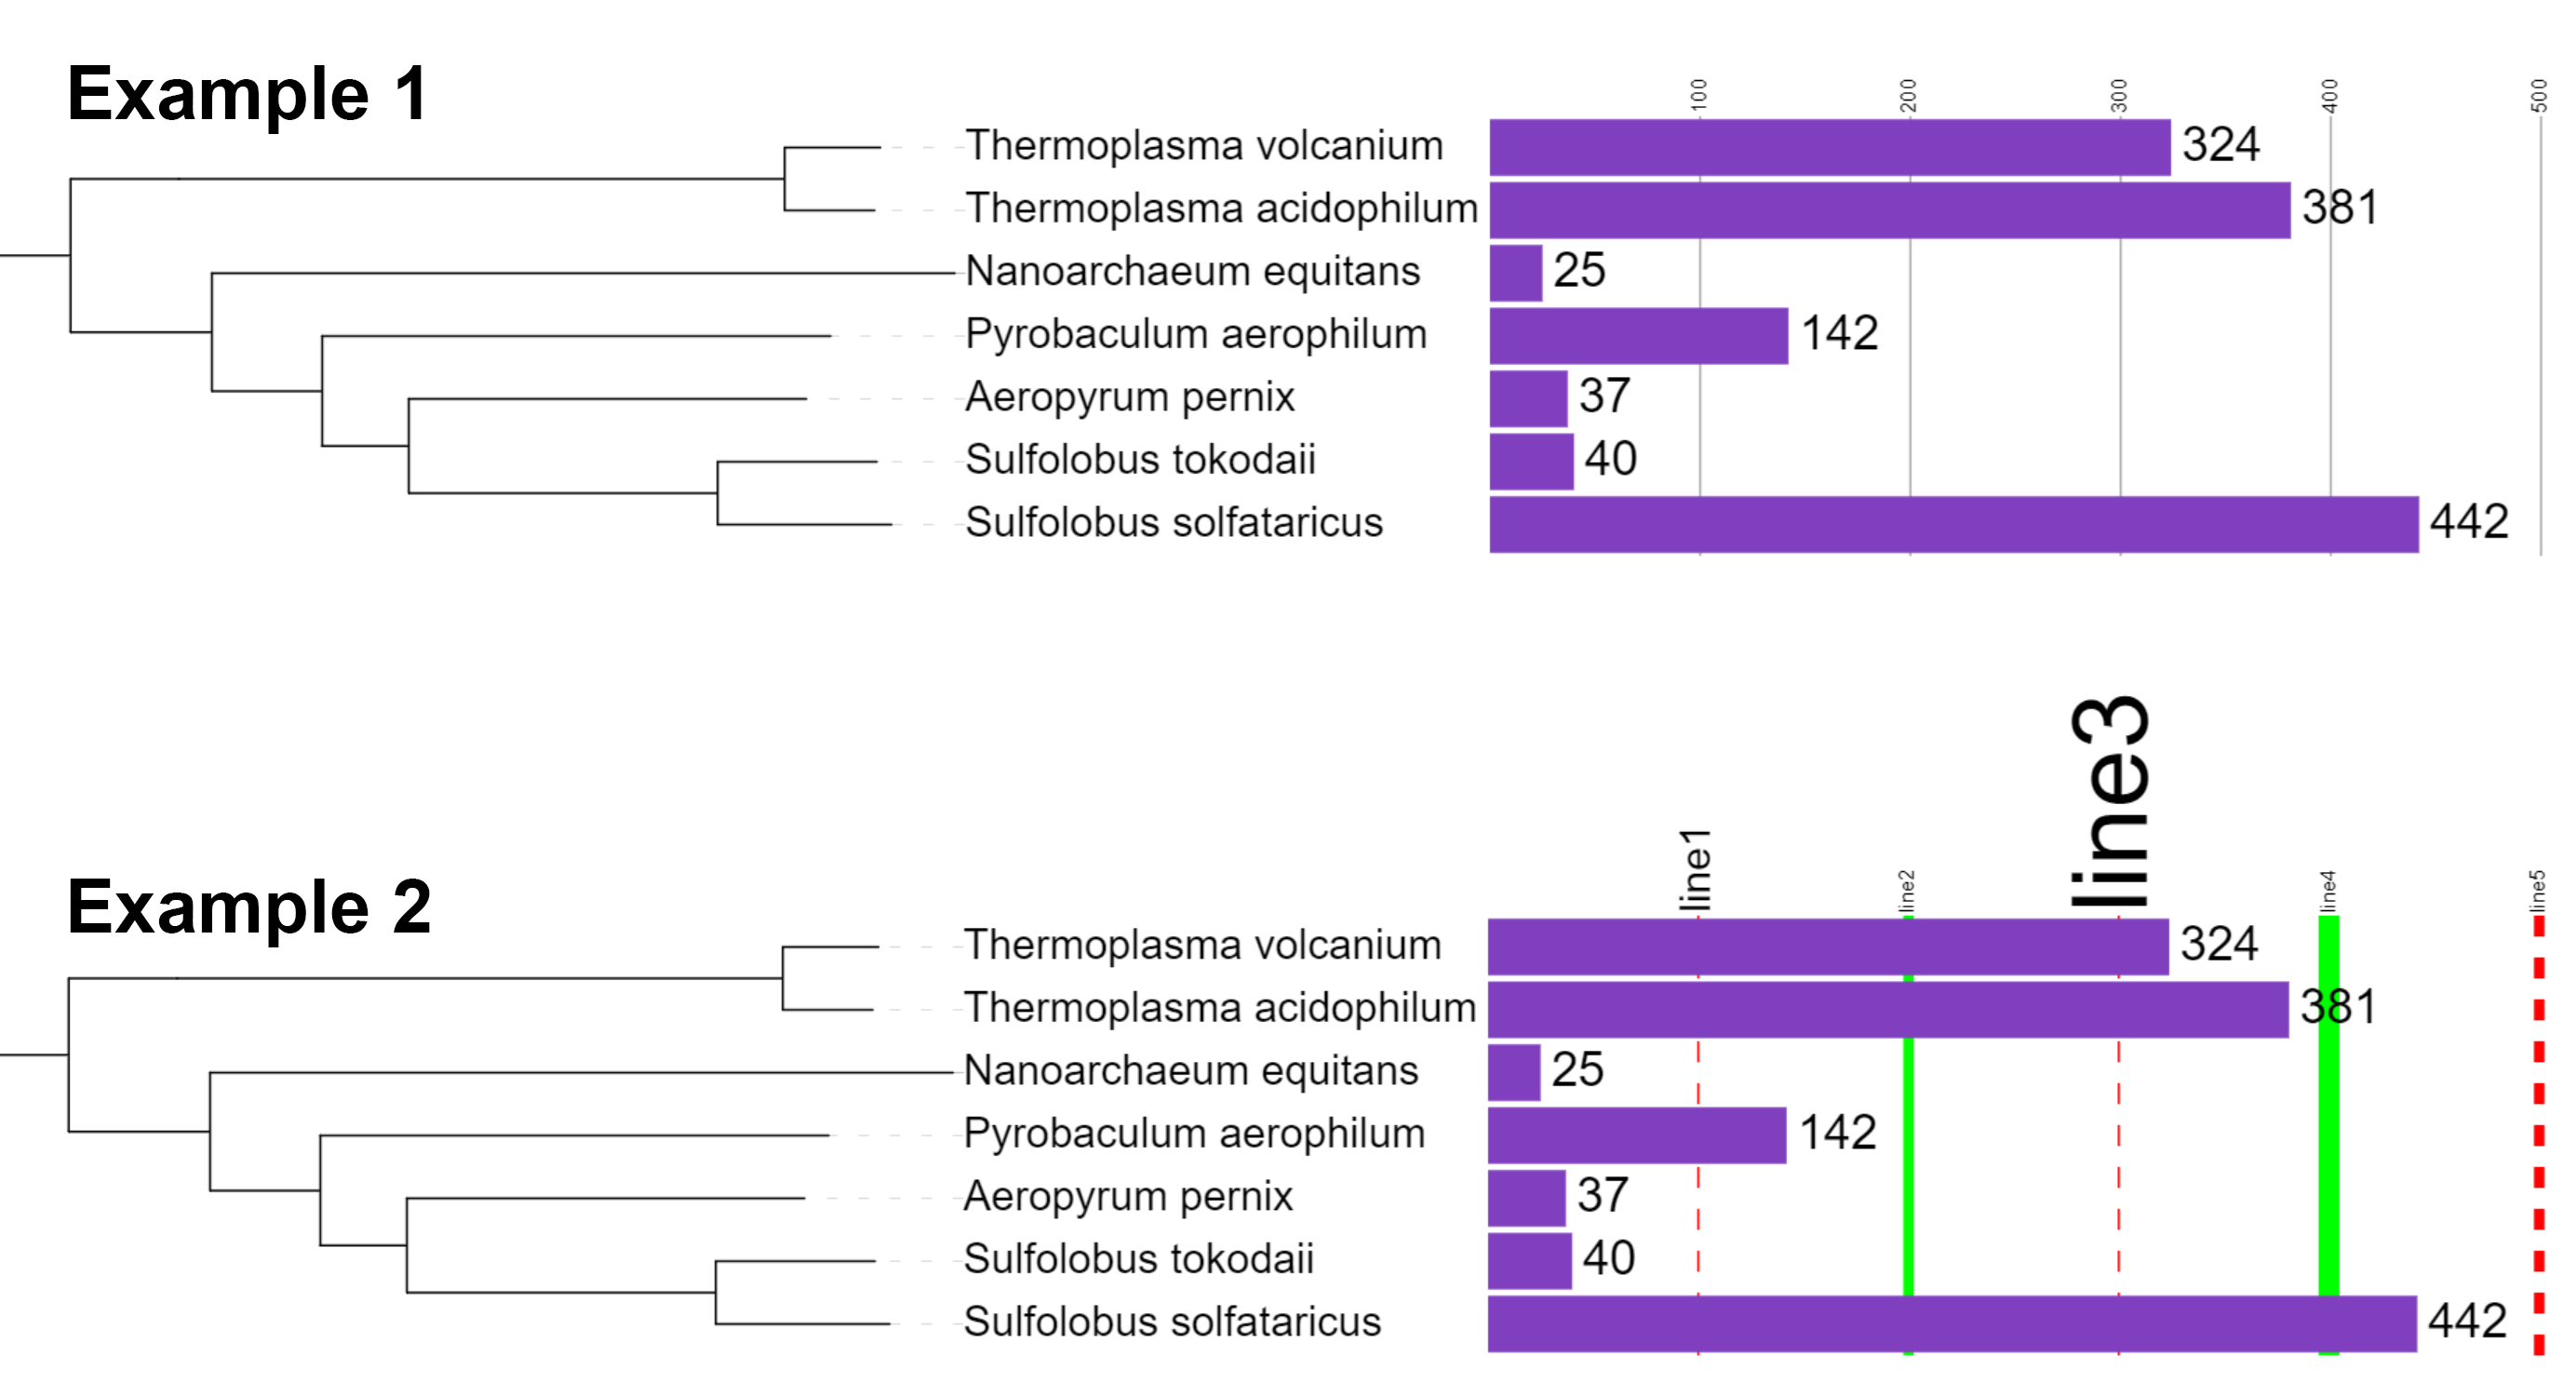
You can simply provide a list of values which define where the scale lines will be displayed (Example 1 below and in the figure on the right). Optionally, it is possible to define the line color and a label to be displayed with each line, as well as the line style (Example 2 below and in the figure on the right). Label, color, width and style (normal or dashed) for a scale line are added after the value, separated with dashes (format: VALUE-LABEL-COLOR-WIDTH-DASHED-LABEL_SCALE_FACTOR):
- VALUE : the value where the scale line will be displayed
- LABEL : label to be displayed next to the scale line
- COLOR : color of the scale line
- WIDTH : width of the scale line in pixels. If omitted, the line will be 1 pixel wide.
- DASHED : if set to 1, scale line will be dashed. If omitted or set to 0, the scale line will be solid.
- LABEL_SCALE_FACTOR : font size of the scale label will be multiplied by this number, if specified
To specify negative values, use the keyword − instead of the actual minus sign (e.g. to draw a line at -200, the value definition would be −200)
Example 1:
DATASET_SCALE,100,200,300,400,500

Example 2:
DATASET_SCALE,100-line1-#ff0000-1-1-2,200-line2-#00ff00-5-0-1,300-line3-#ff0000-1-1-5,400-line4-#00ff00-10-0-1,500-line5-#ff0000-5-1-1
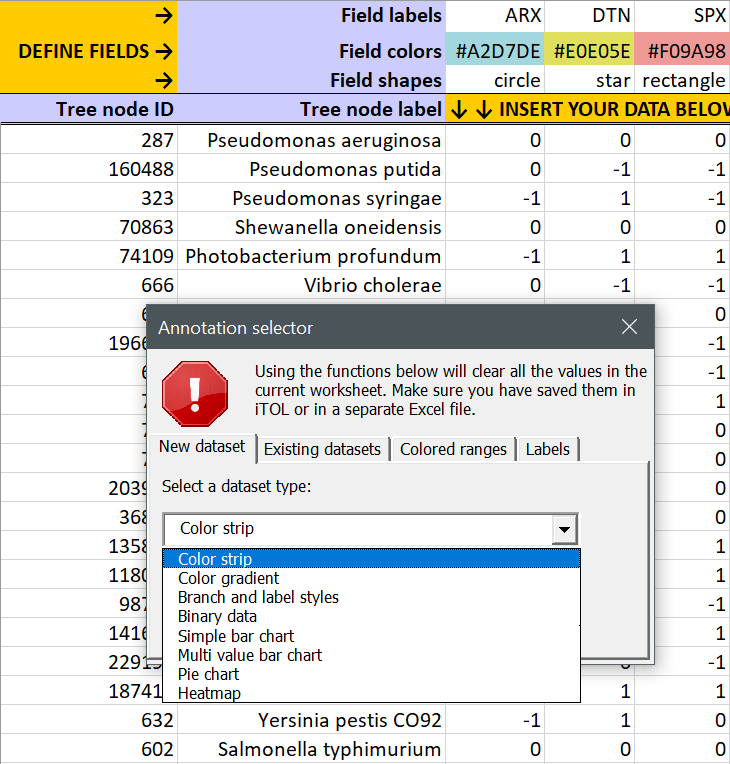
Dataset types
All dataset types supported by iTOL are described below, with links to their corresponding template files. Many dataset types can be created through the web editor, or from Microsoft Excel / LibreOffice Calc / Google Sheets by using the iTOL annotation editor.
Templates are commented and contain one or more examples explaining the various dataset specific options. If you encounter any problems with using these templates, or do not understand some of the available options, please contact the developer.
Binary data 
Template file: dataset_binary_template.txt
Supported by the iTOL annotation editor for spreadsheets
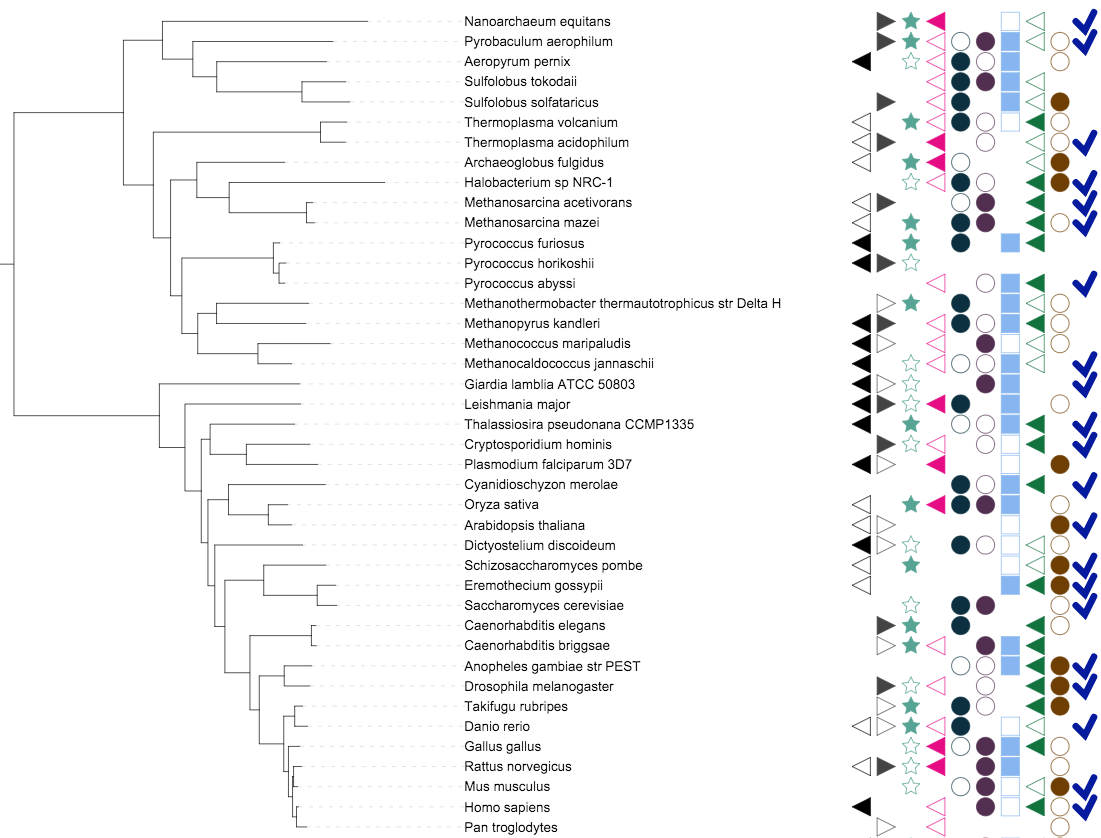
A binary dataset with multiple columns
Binary datasets are visualized as outlined or filled symbols. Each tree node can have multiple fields, and each field can be represented by a different symbol (as defined in the FIELD_SHAPES line) with the corresponding color and label (as defined in the FIELD_COLORS and the FIELD_LABELS lines). Possible data values for each field are:
- 1 : filled shape
- 0 : shape outline
- -1 : shape completely omitted
Shapes are defined in the FIELD_SHAPES line, with a number between 1 and 6:
| 1 | square | |
| 2 | circle | |
| 3 | star | |
| 4 | right triangle | |
| 5 | left triangle | |
| 6 | checkmark |
Simple bar charts 
Template file: dataset_simplebar_template.txt
Supported by the iTOL annotation editor for spreadsheets
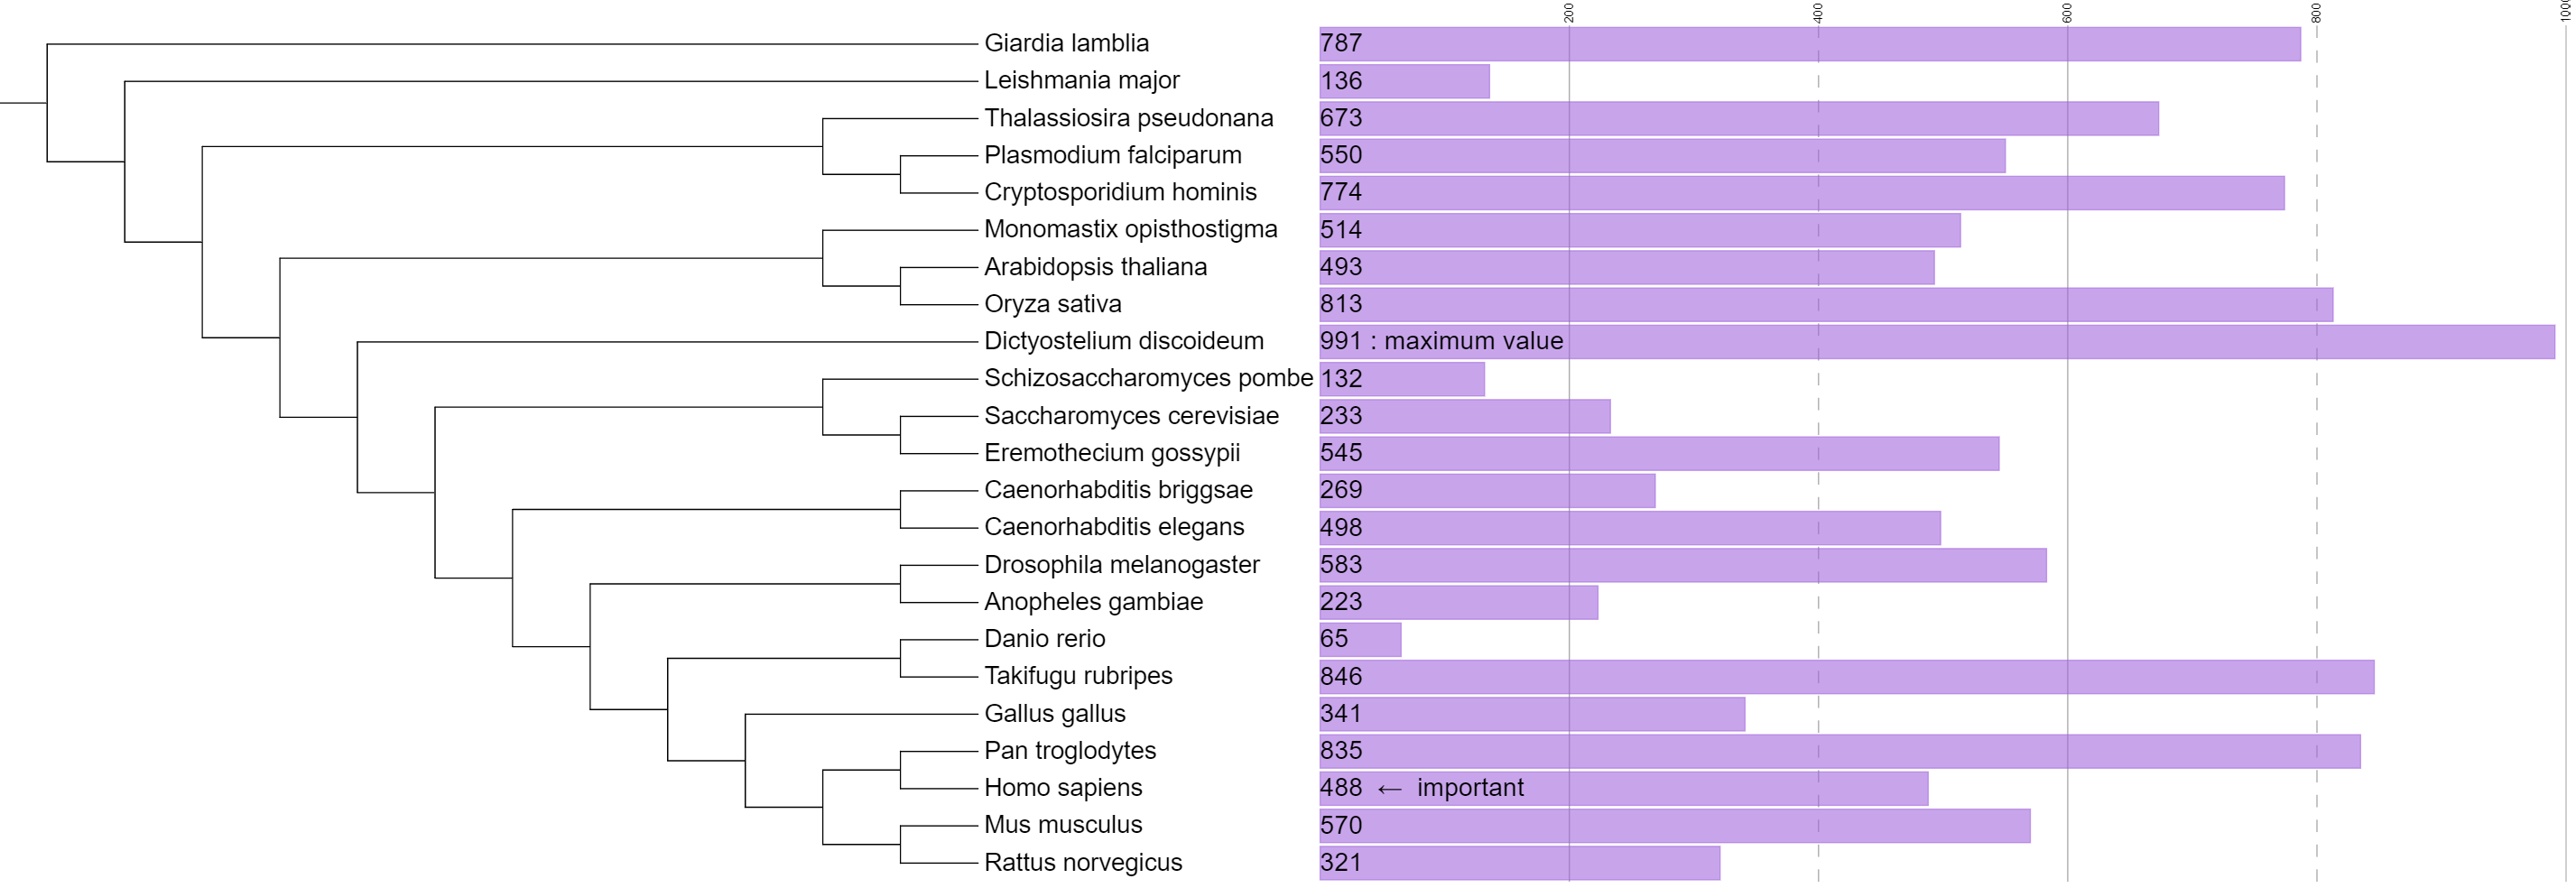
A simple bar chart with values and custom labels displayed inside the bars
In simple bar chart datasets, each tree node is associated to a single numeric value which is displayed as a bar outside the tree.
The bar for the maximum value in the dataset will have the pixel size specified in the MAXIMUM_WIDTH field, with other bars proportionally smaller. The color of the bars is defined in the COLOR field. These values can be changed later through the dataset options tab.
The position and the width of the individual bars can be adjusted through the Left margin (MARGIN), Bar thickness factor (HEIGHT_FACTOR) and Bar shift (BAR_SHIFT) options in the dataset options.
In addition to the numeric value, a custom label can be specified for each node, which can be displayed instead of the value (when SHOW_VALUE and/or SHOW_LABELS are set to 1). The position of the value or custom labels can be changed through the LABEL_POSITION parameter, and fine-tuned by using LABEL_SHIFT_X and LABEL_SHIFT_Y.
Use the LOG_SCALE option to display the bars using a logarithmic scale.
Multi value bar charts 
Template file: dataset_multibar_template.txt
Supported by the iTOL annotation editor for spreadsheets
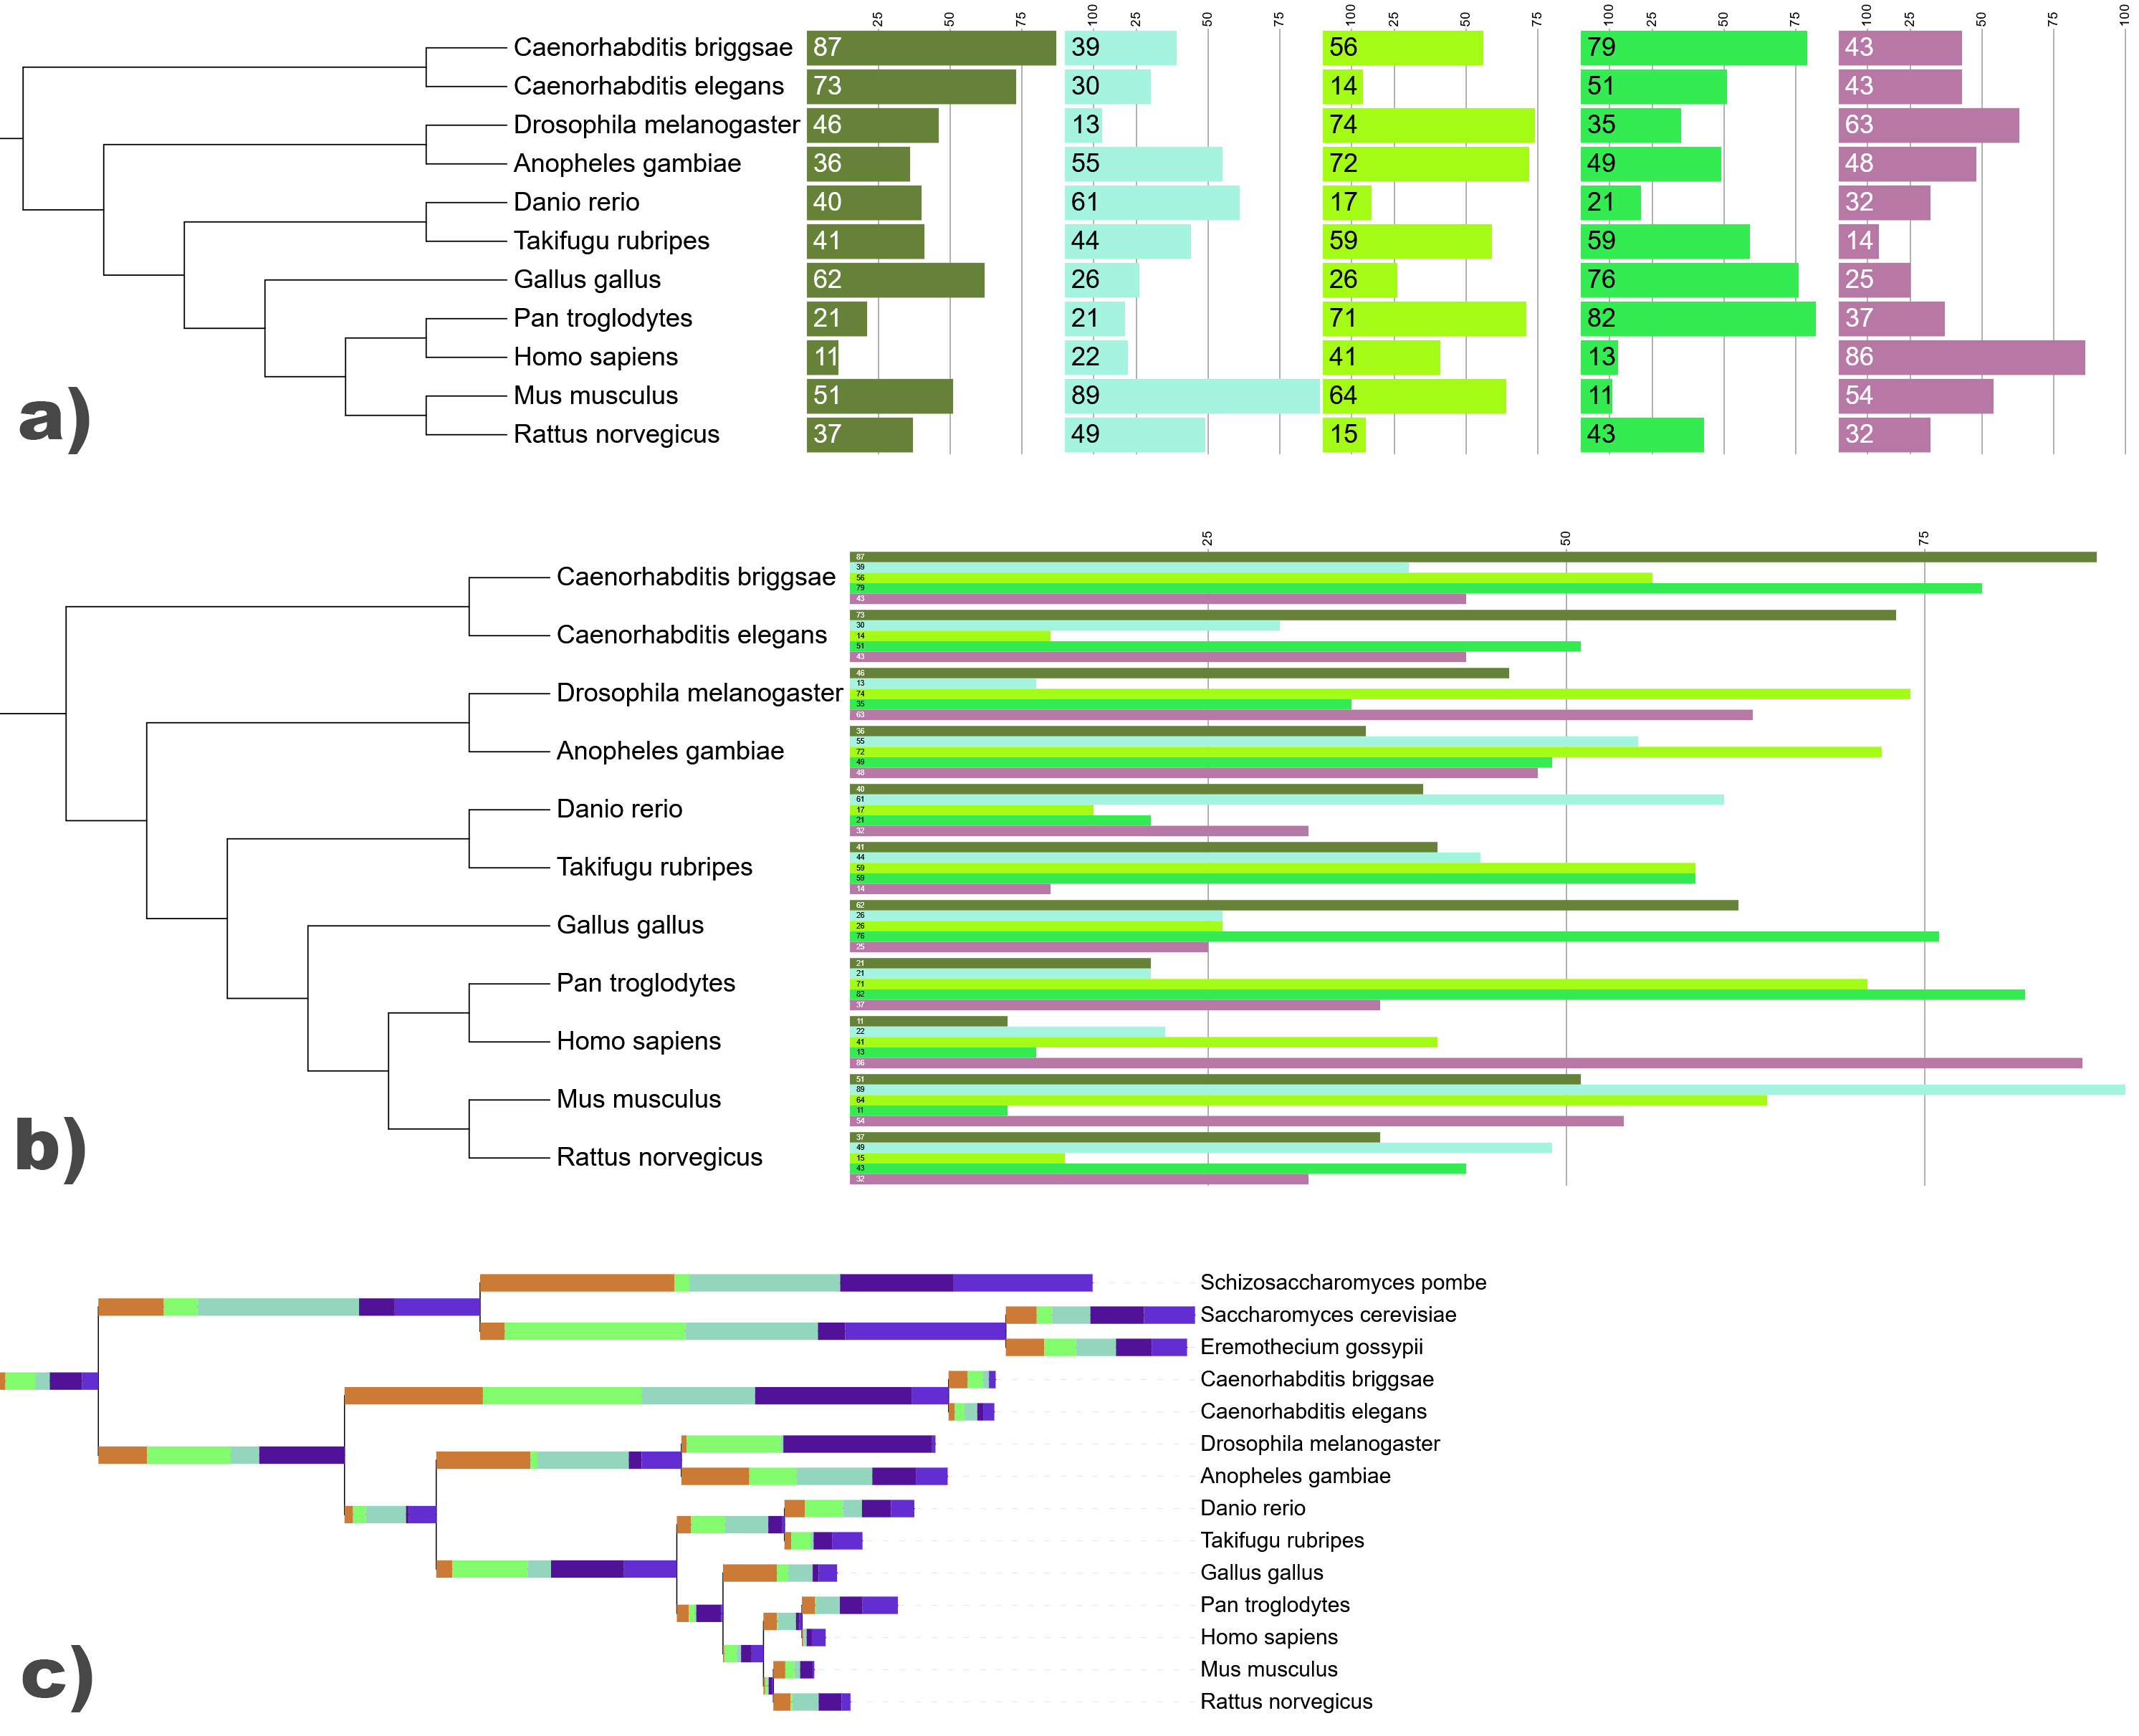
Multi value bar chart datasets with a) aligned and b) side stacked fields and values displayed. In c), the dataset is displayed over the tree branches.
In multi value bar charts, each tree node is associated to multiple numeric values, which are displayed as a stacked or aligned bar chart outside the tree, or directly on the tree branches. Fields are stacked horizontally by default, but they can also be stacked vertically next to each other (example b) on the right). When side stacking many fields, you can use the tree scaling factors on the advanced tab of the control panel to increase spacing between nodes (only in normal tree display mode).
The individual fields (values) must have a corresponding label and color, which are defined through the FIELD_LABELS and FIELD_COLORS lines in the template. The node with the maximum sum of field values will have the total pixel size specified in the MAXIMUM_WIDTH field, with other bars proportionally smaller.
The position and the width of the individual bars can be adjusted through the Left margin (MARGIN), Bar thickness factor (HEIGHT_FACTOR) and Bar shift (BAR_SHIFT) options in the dataset options.
To display the numeric values as text labels inside the bars, set SHOW_VALUE to 1. The position of the value labels can be changed through the LABEL_POSITION parameter, and fine-tuned by using LABEL_SHIFT_X and LABEL_SHIFT_Y. Color of the label can be defined through BAR_LABEL_COLOR, or calculated automatically to match the darkness of the background by setting LABEL_AUTO_COLOR to 1.
Use the LOG_SCALE option to display the bars using a logarithmic scale.
Regularly stacked datasets can also be displayed directly over the tree branches (example c) on the right), by setting the ON_BRANCH parameter to 1. In that case the size of individual bars will be scaled to each branch separately, ie. their sizes are not directly comparable between different nodes.
Note about the scales: If a scale is defined in a multi value bar chart dataset, and its individual fields are aligned, the scale will be duplicated and shown in each individual field (example a) on the right). If the fields are not aligned, only one scale will be shown. When displaying the bars over the tree nodes, no scale is shown.
Pie charts 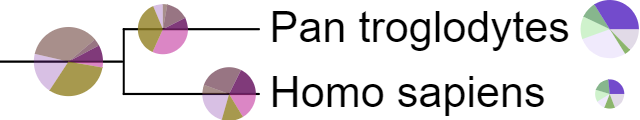
Template file: dataset_piechart_template.txt
Supported by the iTOL annotation editor for spreadsheets
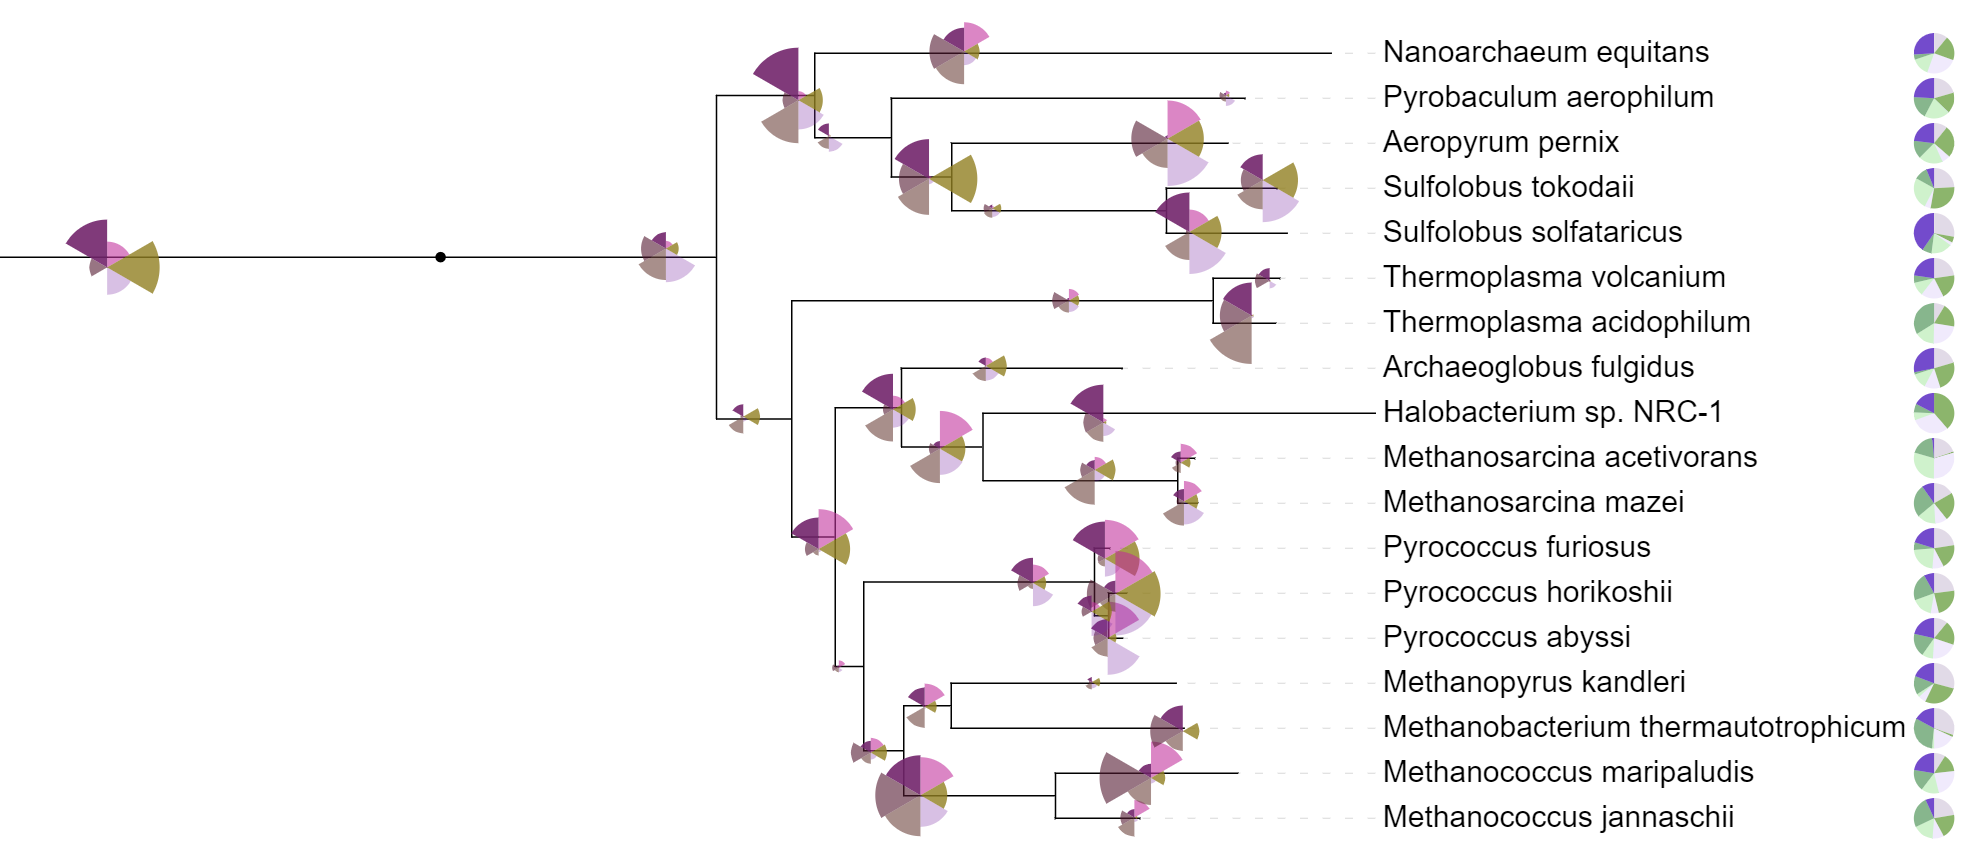
Two pie chart datasets, one with internal and one with external pie charts. Internal dataset is displayed as a polar area diagram, instead of standard pie chart.
In the pie chart datasets, each tree node is associated to multiple numeric values, which are displayed as a pie chart directly on the node branch, or outside the tree. Individual fields (values) must have a corresponding label and color, which are defined through the FIELD_LABELS and FIELD_COLORS lines in the template.
The first field after each node ID in the DATA section specifies the pie chart position. If this value is -1, pie chart will be external (ie. displayed outside the tree). Otherwise, it should be a number between 0 and 1, specifying the ratio of the branch length where the pie chart should be positioned (ie. position 0 is exactly at the start of node branch, 0.5 is in the middle, and 1 is at the end).
The second field specifies the relative pie chart radius. The maximum radius value will be visualized using the pixel value specified in the dataset options, with other radii scaled proportionally.
In addition to standard pie charts (all slices have equal radius, and varying angles), data can be visualized as polar area diagrams (all slices have equal angle, and varying radii), by setting the POLAR_AREA_DIAGRAM option to 1. An example is shown on the right, where internal charts are displayed as polar area diagrams.
Text labels 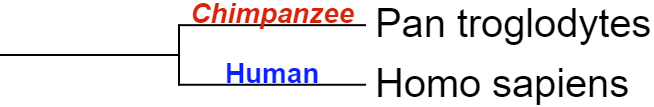
Template file: dataset_text_template.txt
Supported by the iTOL annotation editor for spreadsheets
Internal and external text labels
Text labels with multiple styles
In the text label datasets, each tree node is associated to a single text label, which can be displayed directly on the node branch, or outside the tree.
For each label, the exact position, color, font style, size factor and degree of rotation can be specified.
If the position is set to -1, the label will be external (ie. displayed outside the tree). Otherwise, it should be a number between 0 and 1, specifying the ratio of the branch length where the center of the label should be positioned (ie. position 0 is exactly at the start of node branch, 0.5 is in the middle, and 1 is at the end).
External labels can be aligned to the tree, both in circular and rectangular display modes. This will ignore any other rotation parameters.
Labels are normally rotated to match the current tree rotation. The Straight labels option (STRAIGHT_LABELS line in the template) will make all labels appear straight ( or rotated by their individual rotation angles), regardless of the current tree rotation.
Internal labels can be displayed above or below the branches, and shifted vertically be any amount of pixels. Through this feature, multiple labels can be assigned to a single branch (by using multiple text label datasets).
Labels with multiple styles
To apply multiple font styles to the original tree labels, please use the multi-style label creator or its associtated annotation template.
Text labels dataset can be used to create labels which contain a mixture of different styles. Multiple styles can be used only on external labels (ie. position is set to -1), and which are not aligned to the tree.
Styles are defined through different tags in the text label definition:
- <n> </n> : normal text
- <b> </b> : bold
- <i> </i> : italic
- <bi> </bi> : bold italic
- <sub> </sub> : subscript
- <sup> </sup> : superscript
All parts of the label must be enclosed by one of the possible tags, including any space characters.
Each tag can be expanded with additional attributes:
- color: define a specific color for this part of the label
- size: define a size factor (e.g. 0.5 would make this part half the size)
- font: define a specific font family for this part of the label
Note that the tags (n, b...) and attribute keywords (color, size, font) must be written in lowercase.
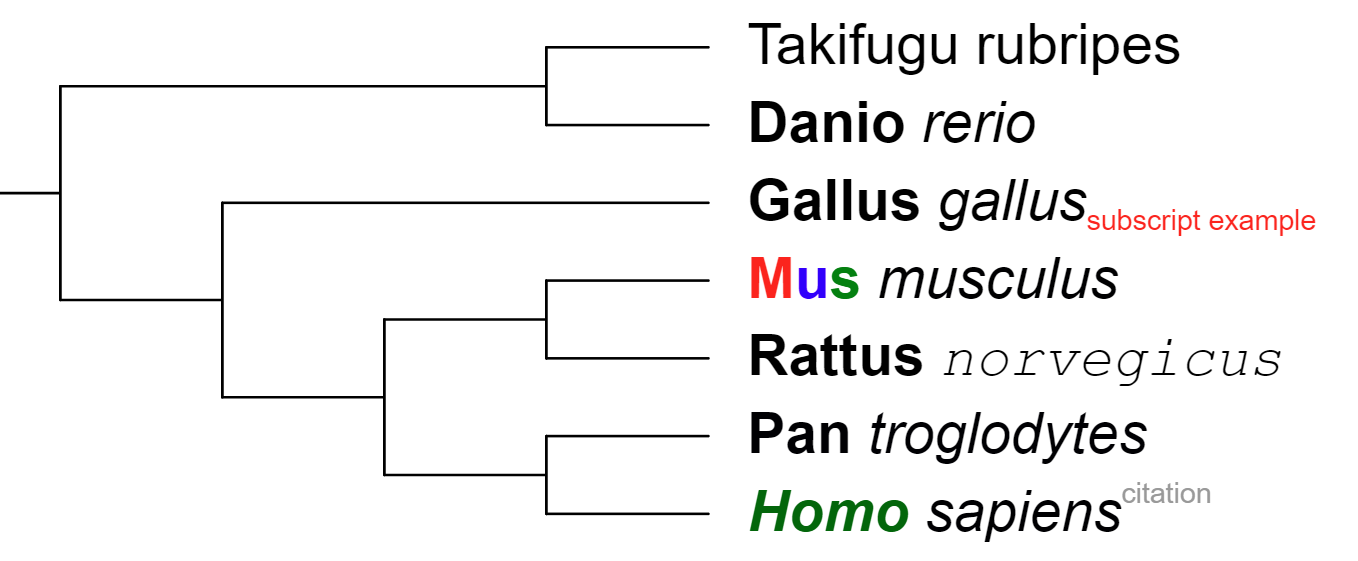
Example (figure on the right):

<n>Takifugu rubripes</n>
<b>Danio </b><i>rerio</i>
<b>Gallus </b><i>gallus</i><sub size='0.5' color='red'>subscript example</sub>
<b color='red'>M</b><b color='blue'>u</b><b color='green'>s </b><i>musculus</i>
<b>Rattus </b><i font='Courier' >norvegicus</i>
<b>Pan </b><i>troglodytes</i>
<bi color='#006600'>Homo </bi><i>sapiens</i><sup size='0.5' color='#999999'>citation</sup>
Branch / external symbols 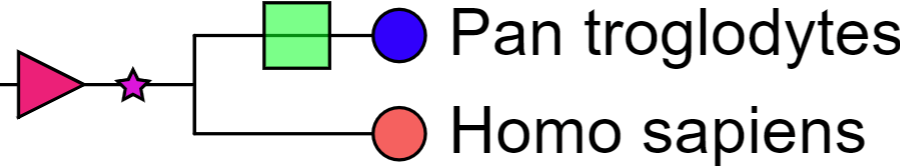
Template file: dataset_symbols_template.txt
Supported by the iTOL annotation editor for spreadsheets
An example symbols dataset, with one or more symbols per branch
Use the symbol datasets to display various shapes directly on the branches of the tree. For each tree node, one or more symbols can be defined. Each symbol's color, size and position along the branch can be specified. Symbols can be filled with color, or drawn as outlines. To fill the symbols with gradients instead of solid colors, use the GRADIENT_FILL option.
Symbol's position can be:
- a number between 0 and 1: symbol will be displayed internally on the tree branch, with the center at the specified ratio of the branch length (ie. position 0 is exactly at the start of the node branch, 0.5 is in the middle, and 1 is at the end).
- a negative integer: symbol will be displayed outside the tree, at the column defined by the integer (ie. position -1 will be the first external column of symbols, position -2 will be the second column and so on)
Shapes are defined with a number between 1 and 5:
| 1 | square |  |
| 2 | circle |  |
| 3 | star |  |
| 4 | right triangle |  |
| 5 | left triangle |  |
| 6 | checkmark |  |
Branch and label styles 
Template file: dataset_styles_template.txt
Supported by the iTOL annotation editor for spreadsheets
An example branch and label styles dataset
This dataset type allows the customization of the display styles for tree branches and leaf labels. It has all the functionality of the TREE_COLORS annotation file, but acts as a dataset. Therefore, multiple separate style datasets can be present on a tree, and you can switch between various branch/label styles interactively. If multiple styles datasets are turned on simultaneously, only the last one will be applied.
Style definitions can be applied to single nodes/labels, or to the whole clades. Check the template file for details.
Colored/labeled ranges 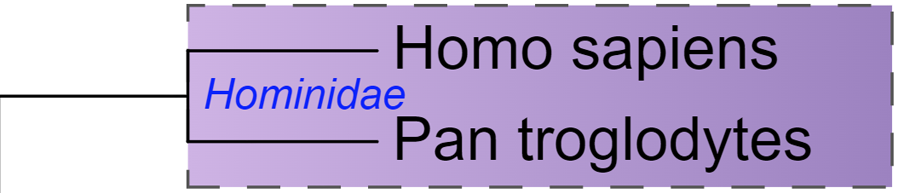 Video tutorial
Template file: dataset_ranges_template.txt
Supported by the iTOL annotation editor for spreadsheets
Various types of colored/labeled ranges
Use this dataset type to highlight various clades or leaf ranges by using colored boxes or brackets. It has all the functionality of the colored ranges defined through a TREE_COLORS annotation file, but acts as a dataset. Therefore, multiple separate colored/labeled range datasets can be present on a tree, each with a different style and individual options (e.g. image on the right has 6 different range datasets).
Ranges are defined with a START_NODE_ID and an END_NODE_ID. These can both point to the same node, and they can also be internal tree nodes. Multiple ranges can be created from a single definition line by using the CONTAINS== keyword in the START_NODE_ID field. In this case, END_NODE_ID is ignored, and ranges will be created for each node which matches the provided keyword.
Ranges can be visualized as colored boxes/polygons or as different types of brackets (square, curved or plain lines).
If both FILL_COLOR and GRADIENT_COLOR are defined, the range box will be filled with a color gradient or the bracket line color will be a gradient.
Each range can have a text label defined, which can be individually styled and positioned.
In the unrooted tree display mode, ranges will be displayed as polygons which can be simplified or smoothed through the parameter UNROOTED_SMOOTH. Label positioning is limited in unrooted display mode.
Colored strips 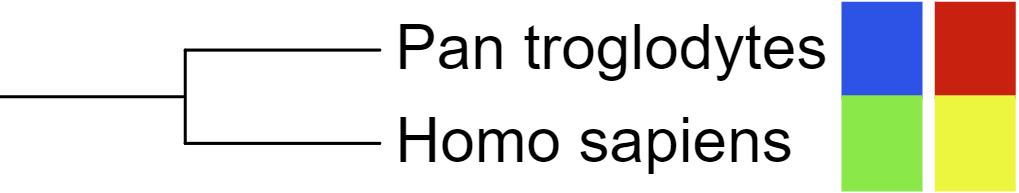
Template file: dataset_color_strip_template.txt
Supported by the iTOL annotation editor for spreadsheets
An example color strip, with the COLOR_BRANCHES option used
In colored strip datasets, each tree node is associated to a color definition which is displayed as a filled rectangle outside the tree, and can have an optional label (shown in the popup when hovering over the colored rectangle). Similar to all other color definitions in iTOL, the color can be specified in hexadecimal, RGB or RGBA notation (if transparency is required).
Each colored strip can have a border of varying width and color. By default, the border will be displayed as a separator along the complete strip (ie. on the sides towards the tree and following datasets). Use the COMPLETE_BORDER option to draw the border around each individual strip box instead.
Individual strip labels (when defined) can be displayed inside the colored boxes by using the SHOW_STRIP_LABELS option. You can adjust the label position (STRIP_LABEL_POSITION), color (STRIP_LABEL_COLOR), size factor relative to the tree leaf labels (STRIP_LABEL_SIZE_FACTOR), label rotation (STRIP_LABEL_ROTATION; only applicable in the rectangular display mode), label shift (STRIP_LABEL_SHIFT) and the text outline width (STRIP_LABEL_OUTLINE; can be used to highlight transparent or similarly colored labels). Color of the labels can be calculated automatically to match the darkness of the color strip by setting STRIP_LABEL_AUTO_COLOR to 1.
By using the COLOR_BRANCHES template option, the colors of tree branches will match the colored strips above them. Ancestral branches whose children have identical colors will be colored as well, propagating the branch coloring towards the root of the tree.
Color gradients 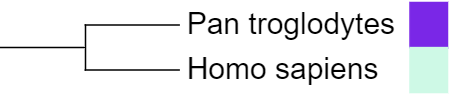
Template file: dataset_gradient_template.txt
Supported by the iTOL annotation editor for spreadsheets
A color gradient dataset
In color gradient datasets, each tree node is associated to a single numeric value, which is displayed as a colored rectangle outside the tree.
Dataset values are mapped to a color gradient defined in the annotation file (through the fields COLOR_MIN, COLOR_MAX and optionally COLOR_MID). The colors can also be changed through the dataset options tab of the control panel.
If the option USE_MID_COLOR is set to 1, a three color gradient is created, with the mid-point numeric value in the dataset represented by the COLOR_MID color.
Each color gradient can have a border of varying width and color.
Connections 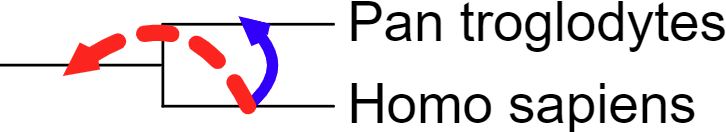
Template file: dataset_connections_template.txt
Supported by the iTOL annotation editor for spreadsheets
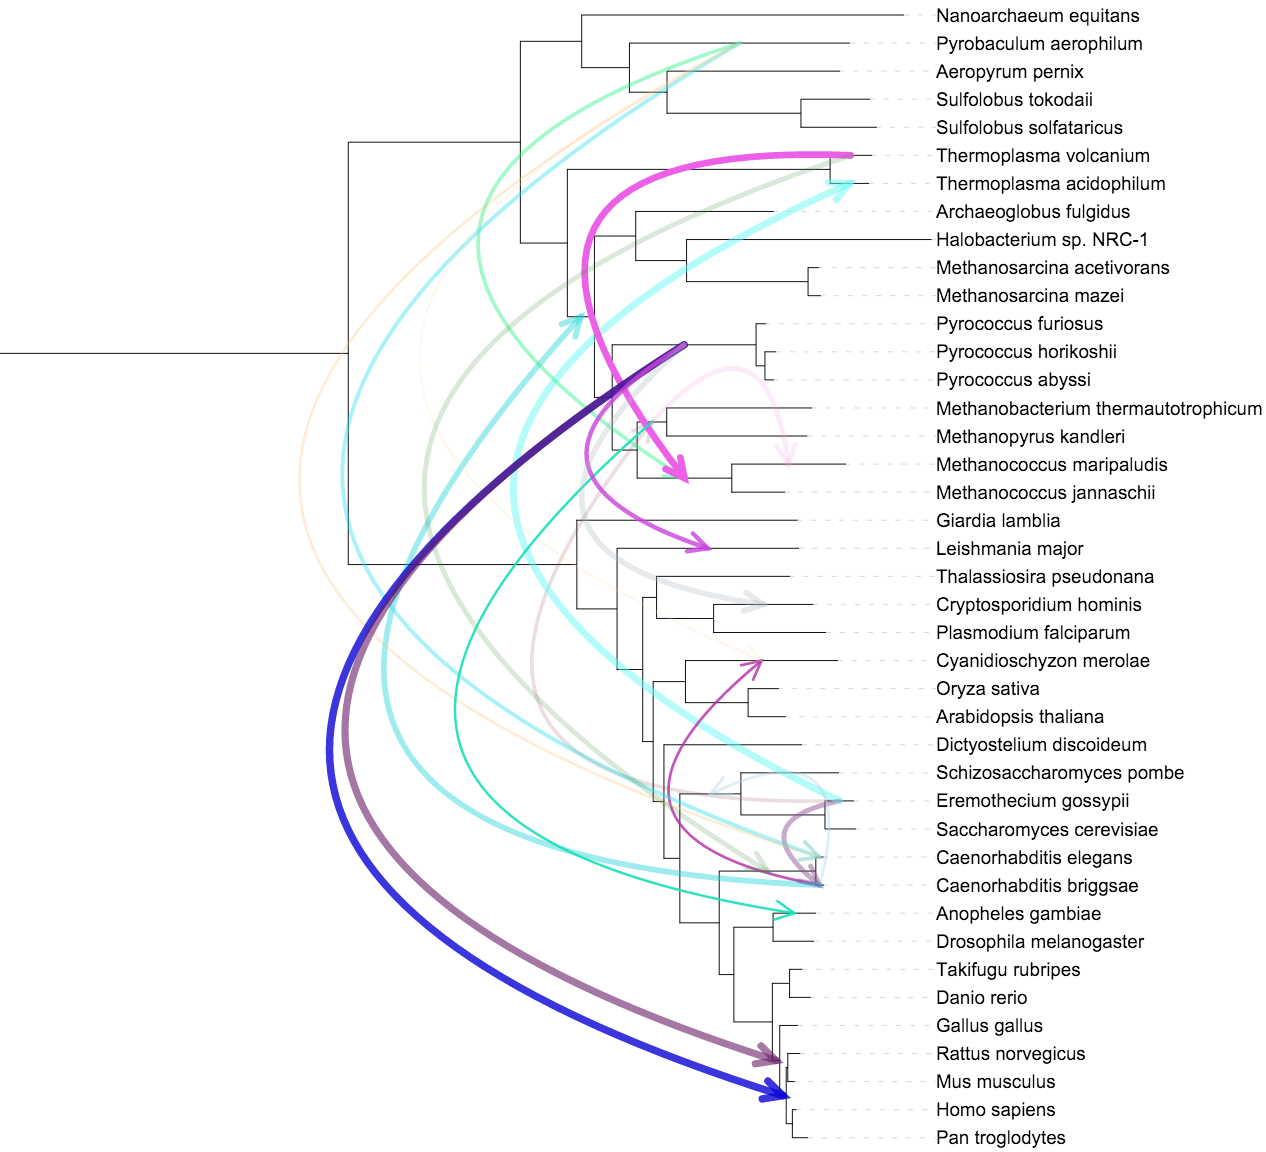
An example connections dataset with arrow heads displayed
Connections datasets allow the drawing of straight or curved lines between any two nodes in the tree. Width, color, style (normal or dashed) and opacity can be set for each connection. Optionally, arrow heads can be displayed to denote the direction of the connection lines.
The connection lines will be straight by default, but the curvature angle can be adjusted through CURVE_ANGLE option. When the tree is displayed in circular or unrooted modes, you can use the Center curves option (CENTER_CURVES in the template) to pull the connection lines towards the tree root, instead of using the curve angle.
Connections within a single node (ie. where source and destination nodes are the same) are displayed as loops, whose size can be changed through the LOOP_SIZE option.
If the Align to labels option is set, connection start and end points will be aligned to the outside of the tree labels, regardless of the actual position of the nodes in the tree (ie. even connections to or from internal tree nodes will be displayed outside the leaf labels).
Tanglegram  Video tutorial
Template file: dataset_tanglegram_template.txt
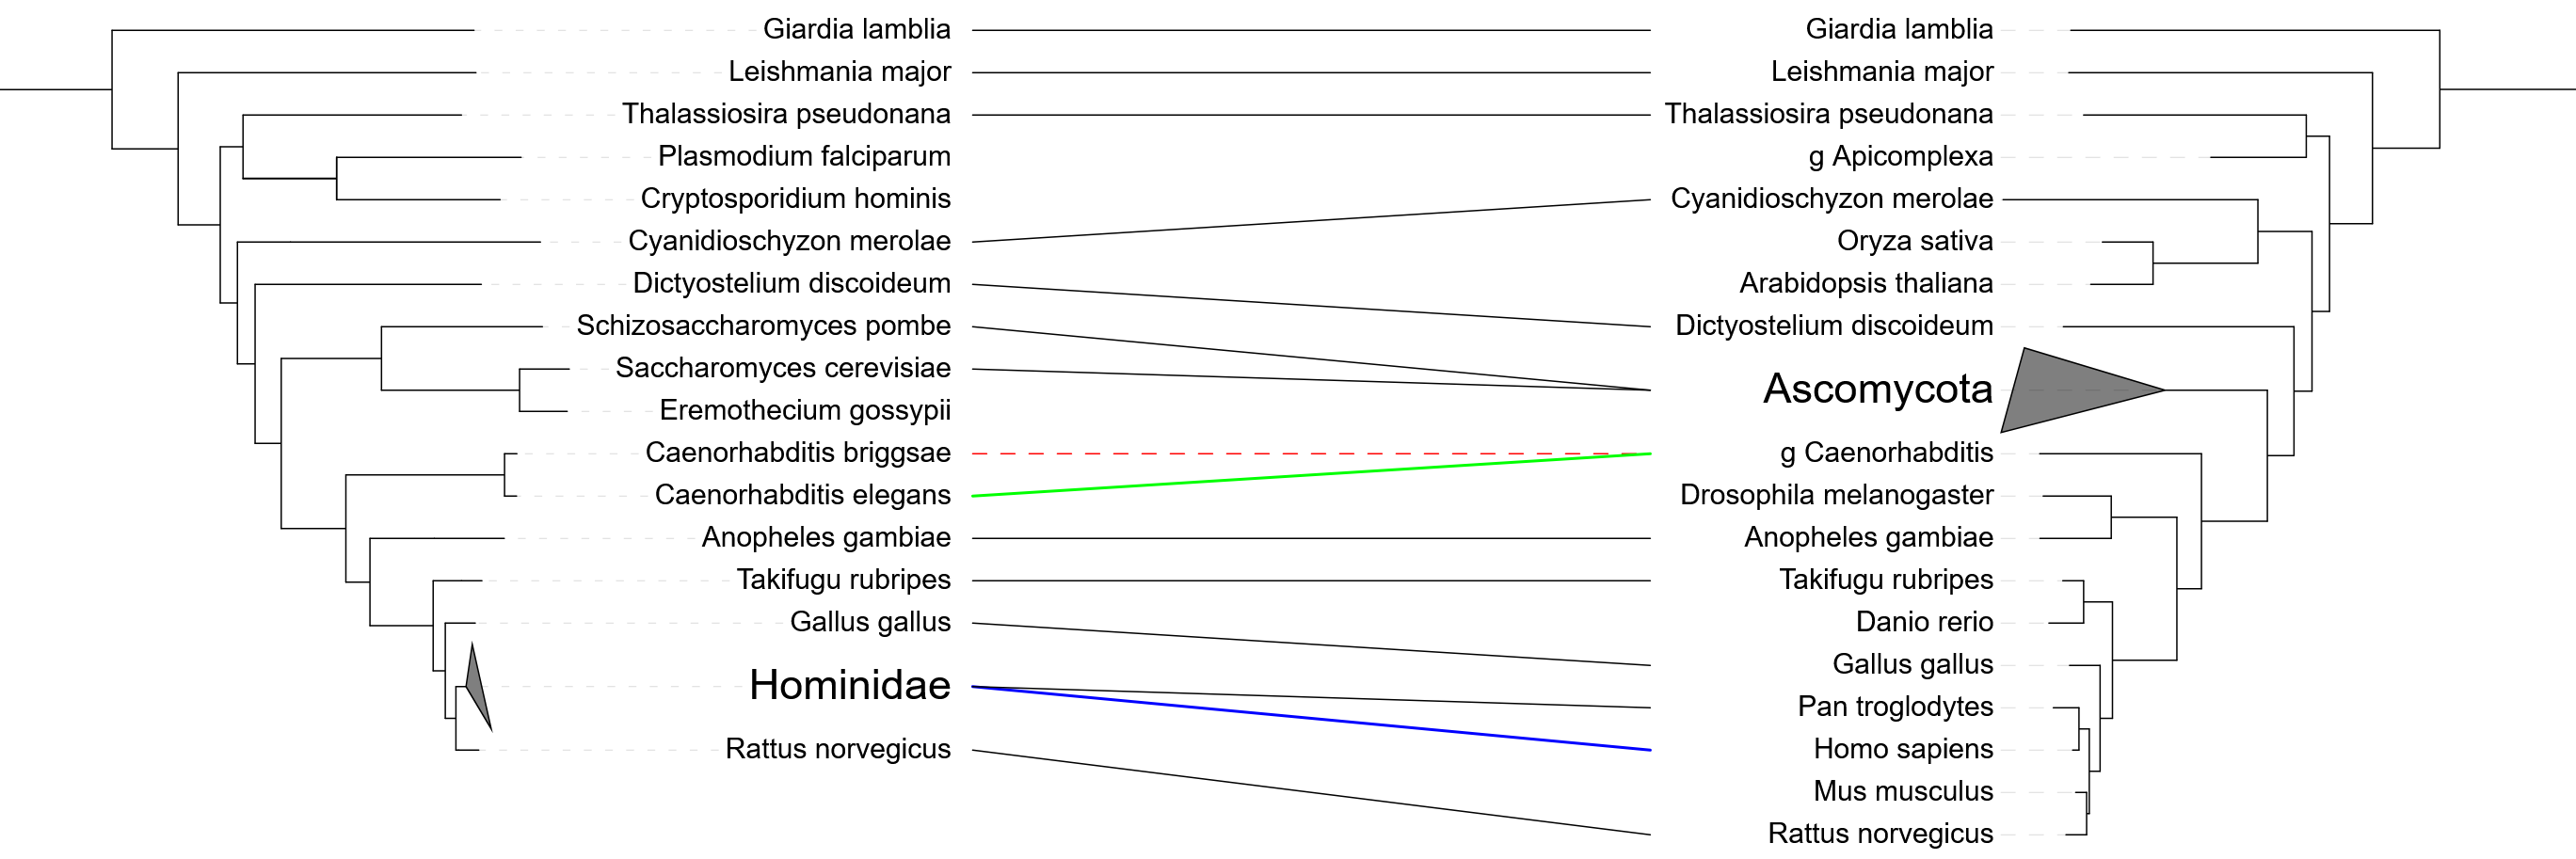
Comparing similar trees through a tanglegram dataset
In tanglegram datasets, an additional tree is displayed next to the main tree, and their leaves/nodes linked with a set of connections.
The tree definition should be placed between the TANGLEGRAM_TREE and END_TANGLEGRAM_TREE fields in the template. The tree can be in Newick or Nexus format, with full support for additional metadata (including NHX and MrBayes metadata). All nodes with matching IDs will be linked automatically, and additional connections can be defined in the DATA section of the template.
As described in the template comments, the DATA section in the tanglegram dataset can be used to define different annotation types, depending on the first field in each line:
- Connections (connect): use this annotation type to define connections between leaves/nodes whose IDs are not identical in both trees. This can be also used to define a particular style of the connection line for the matching nodes.
- Branch/label styles (style): use this annotation type to set the styles for branches and labels of the tanglegram tree. The field definition format is the same as in the 'Branch / label styles' dataset.
- Colored strips (colorstrip): visualize one or more colored strips next to the tanglegram tree. Multiple colored strips can be defined by using different COLUMN_INDEX values. Each COLUMN_INDEX defines a single colored strip: index 1 will be the first strip next to the tanglegram tree, followed by 2 and so on.
- Branch / external symbols (symbol): use this annotation type to visualize symbols on the tangleram tree branches, or next to the tree. The field definition format is the same as in the 'Branch / external symbols' dataset. To define external symbols (i.e. displayed next to the tanglegram tree), you should use negative integer values when defining the position (e.g. position -1 will be the first symbol column outside the tree, followed by -2 and so on). Note that these external positions are shared with the Colored strips, e.g. external symbol position -2 corresponds to the COLUMN_INDEX 2 in the colored strips. This allows the definition of multiple external colored strips mixed with symbol columns.
Tanglegram trees include many of the interactive functions which are available in the main tree: collapsing clades, rotating clades, changing node labels, setting the branch/label styles. In addition, the following features will be applied to the tanglegram tree in parallel to the main tree, using identical parameters:
- Internal tree scale display
- Using or ignoring branch lengths
- Changing the leaf sort order
- Using the tree scaling factors
- Displaying node metadata, branch lengths, node IDs or range metadata
- Displaying node symbols
Heatmaps 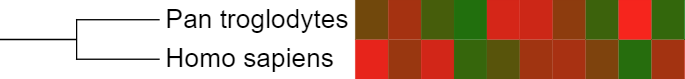
Template file: dataset_heatmap_template.txt
Supported by the iTOL annotation editor for spreadsheets
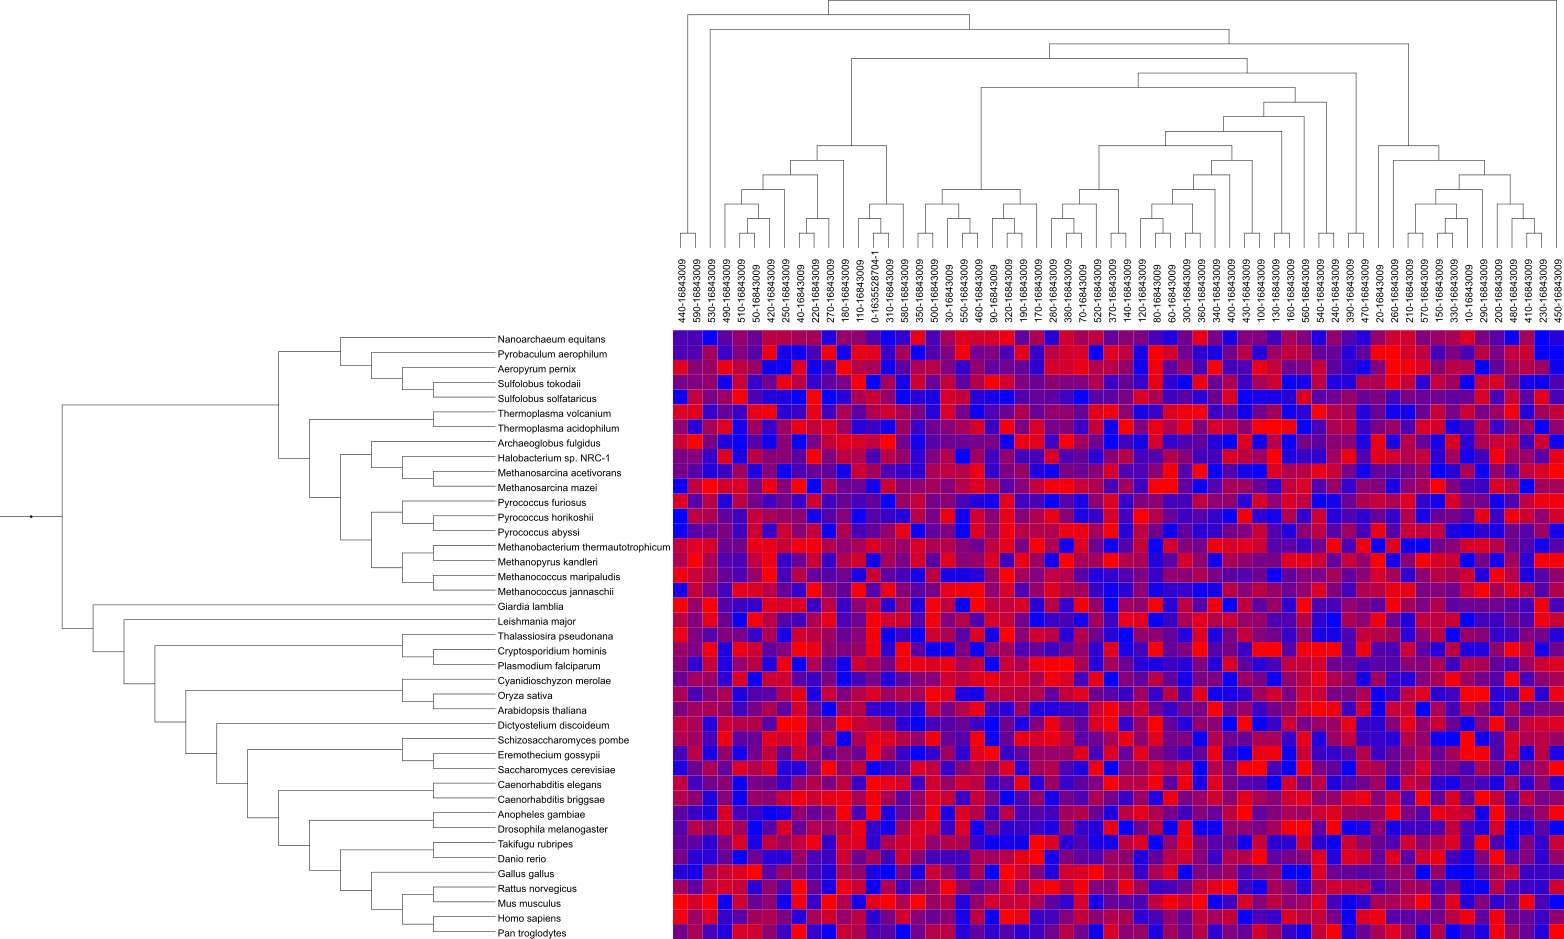
A heatmap dataset with an additional tree
In heatmap datasets, each tree node is associated to multiple numeric values, which are displayed as a set of colored boxes. Dataset values are mapped to a color gradient defined in the annotation file (fields COLOR_MIN, COLOR_MAX and optionally COLOR_MID), which can also be changed through the dataset options tab.
Individual fields are defined in the FIELD_LABELS line, and they will be displayed above the color matrix.
Optionally, an additional Newick formatted tree can be specified in the FIELD_TREE line. If present, this tree will be displayed above the dataset labels, and will be used to define the order of the fields in the matrix.
Empty data fields can be specified using the letter 'X' instead of the numeric value. These will be colored using a separate color, defined using the option COLOR_NAN.
Original heatmap data can be normalized in several ways. First select the direction of normalization by setting the DATA_NORMALIZATION to 'rows' (which will normalize the data for each tree node), or 'columns' (which will normalize the data for each heatmap field). The following normalization types are available, and set through the NORMALIZATION_TYPE field:
- normal: values will be normalized between 0 and 1 (or custom values A and B, specified in the field NORMALIZATION_RANGE) by using the formula A+(val-min)*(B-A)/(max-min)
- mean: values will be normalized between -1 and 1 by using the formula (val-mean)/(max-min)
- scaling: values will be Z-score normalized by using the formula (val-mean)/std.dev
Actual numeric values can be displayed in the heatmap boxes through the field DISPLAY_VALUES. Set it to 'original' to display the actual data values, or 'normalized' to display the normalized value (applicable only when data normalization is used). You can customize the style of the value label display by using VALUE_COLOR, VALUE_SHIFT, VALUE_ROTATION and VALUE_SIZE_FACTOR. Color of the label can be calculated automatically to match the darkness of the background by setting VALUE_AUTO_COLOR to 1.
Use VALUES_SCI_NOTATION to display values in scientific notation (e.g. 1e3 for 1000) and ROUND_VALUES to set the number of decimals.
Protein domains 
Template file: dataset_protein_domains_template.txt
Supported by the iTOL annotation editor for spreadsheets
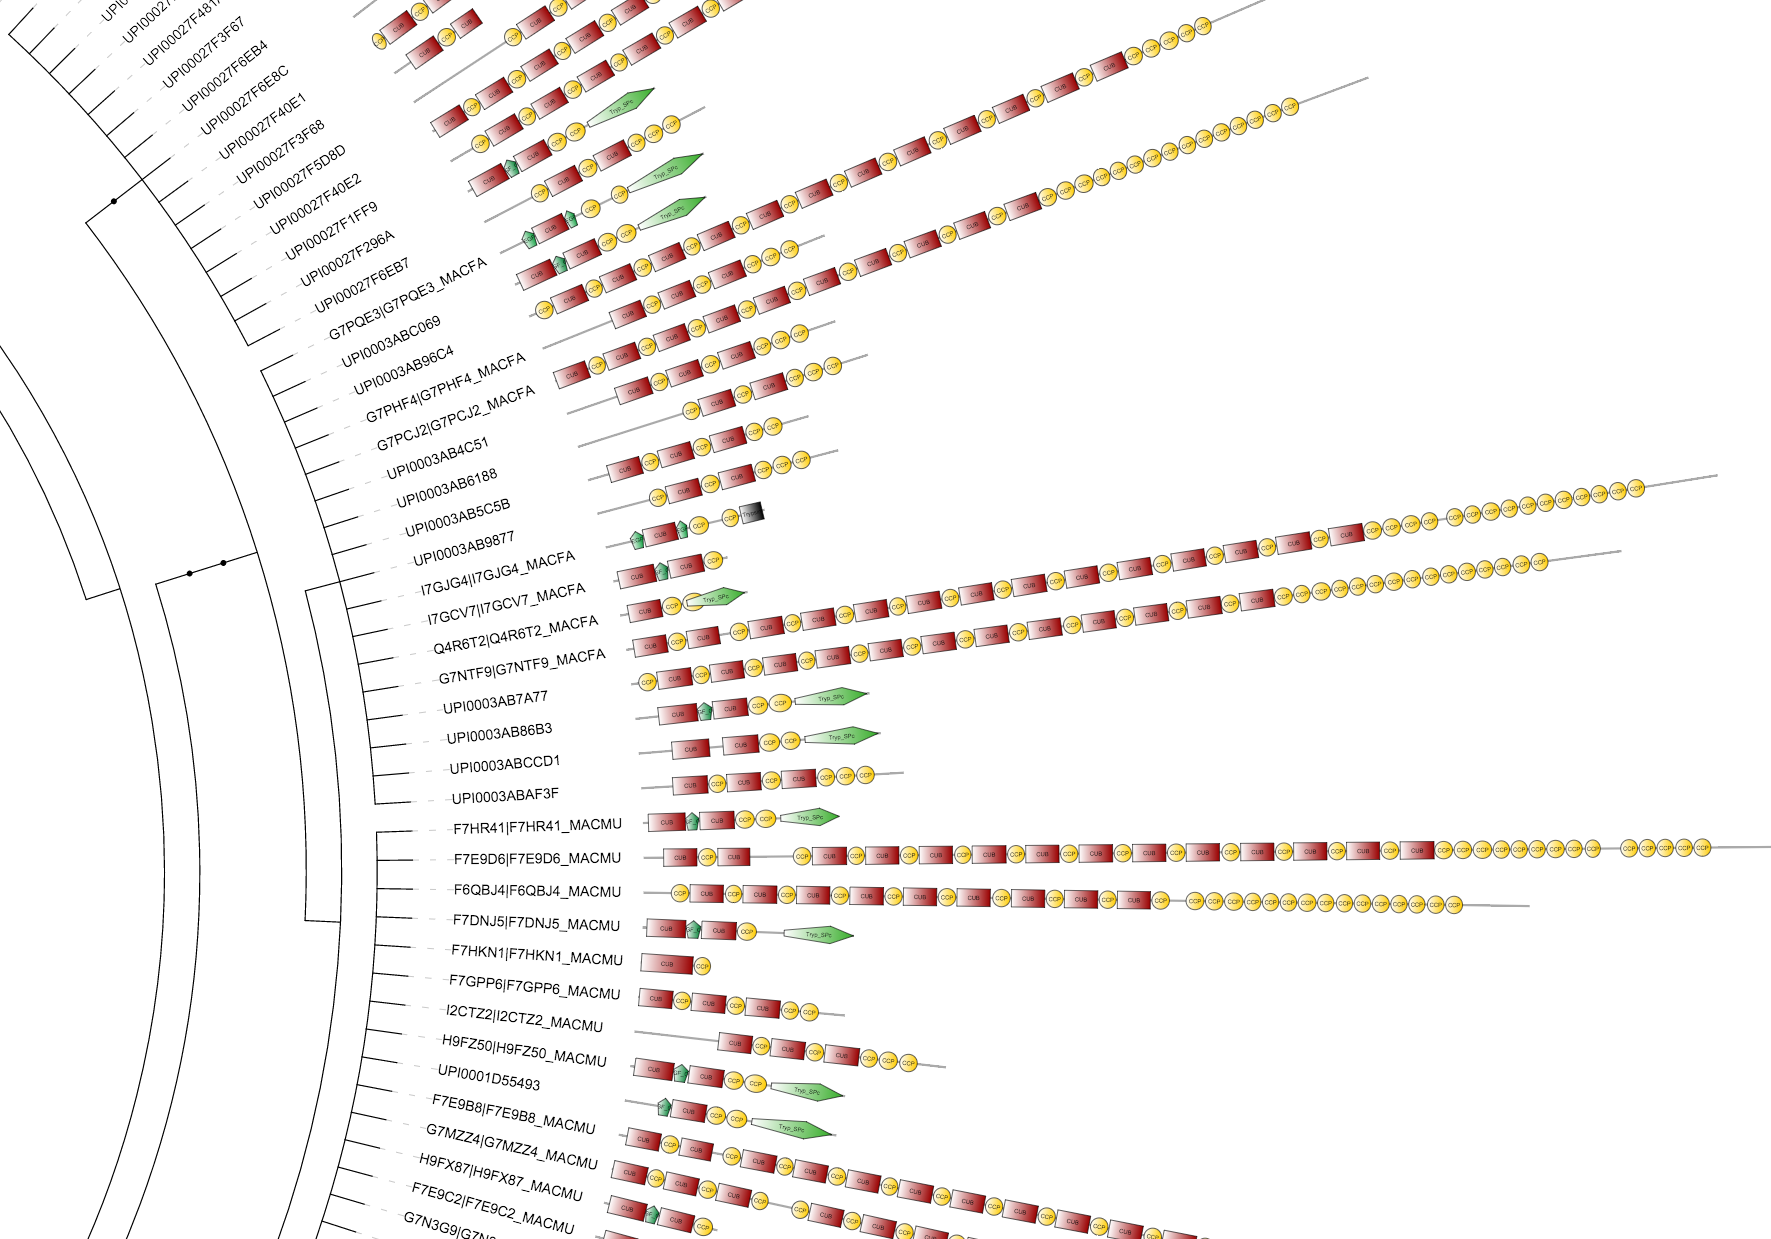
An example protein domain architecture dataset, exported from SMART
Protein domain datasets are visualized as schematic representations of proteins, with a protein backbone and various shapes depicting the locations of individual domains. Even though their primary use is for the display of protein domain architectures, these can be used for various other purposes, as they offer a lot of flexibility.
Each tree node can have one protein definition assigned, with the total protein length defined in second field, followed by an unlimited number of domain definition fields. Each domain definition consists of 5 parts, separated with vertical lines:
SHAPE|START|END|COLOR|LABEL
The domains span positions start to end (inclusive), and the start value 0 corresponds to the protein start.
The domain shape codes are:
| Code | Shape | Example |
|---|---|---|
| RE | rectangle | 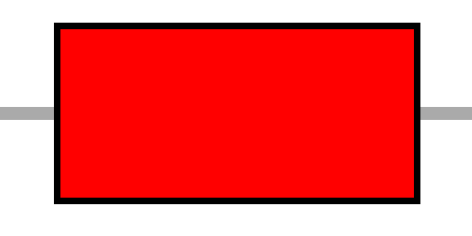 |
| HH | horizontal hexagon | 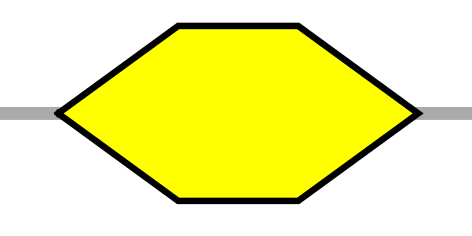 |
| HV | vertical hexagon | 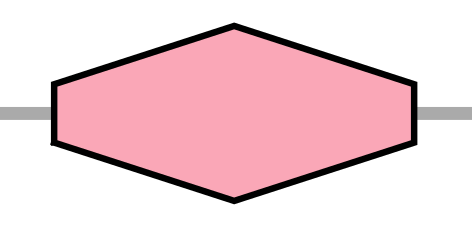 |
| EL | ellipse | 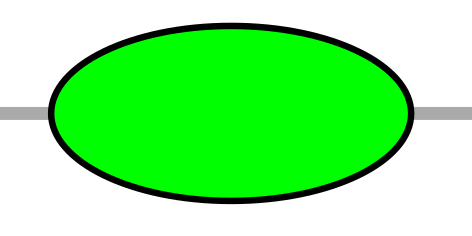 |
| DI | rhombus (diamond) | 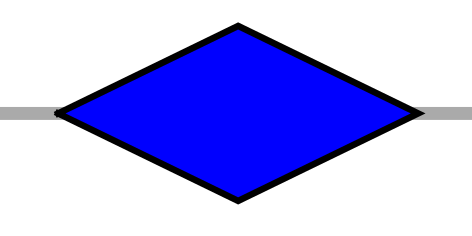 |
| TR | right pointing triangle | 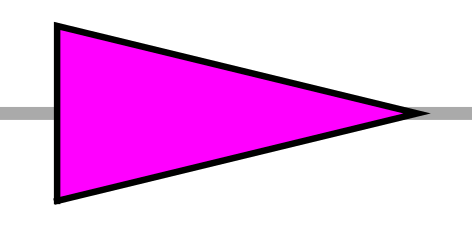 |
| TL | left pointing triangle | 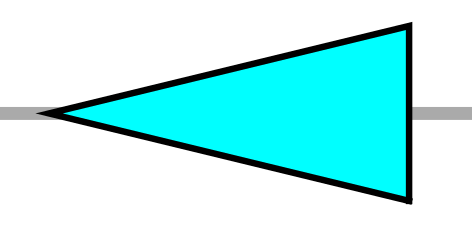 |
| PL | left pointing pentagram | 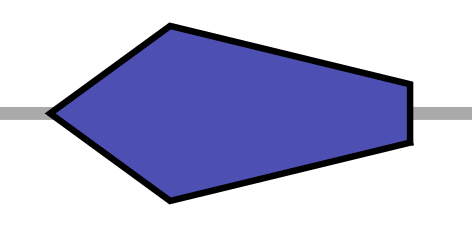 |
| PR | right pointing pentagram | 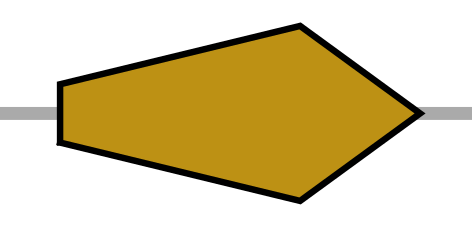 |
| PU | up pointing pentagram | 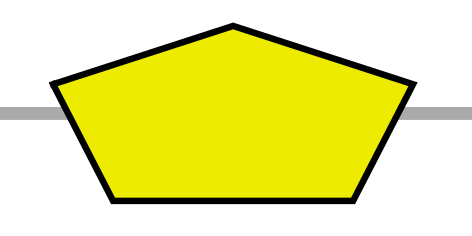 |
| PD | down pointing pentagram | 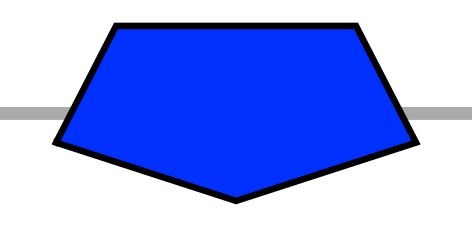 |
| OC | octagon | 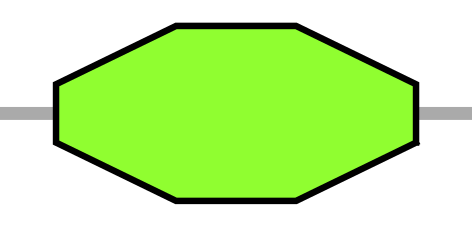 |
| GP | rectangle (gap) |  |
Arrows 
Template file: dataset_arrows_template.txt
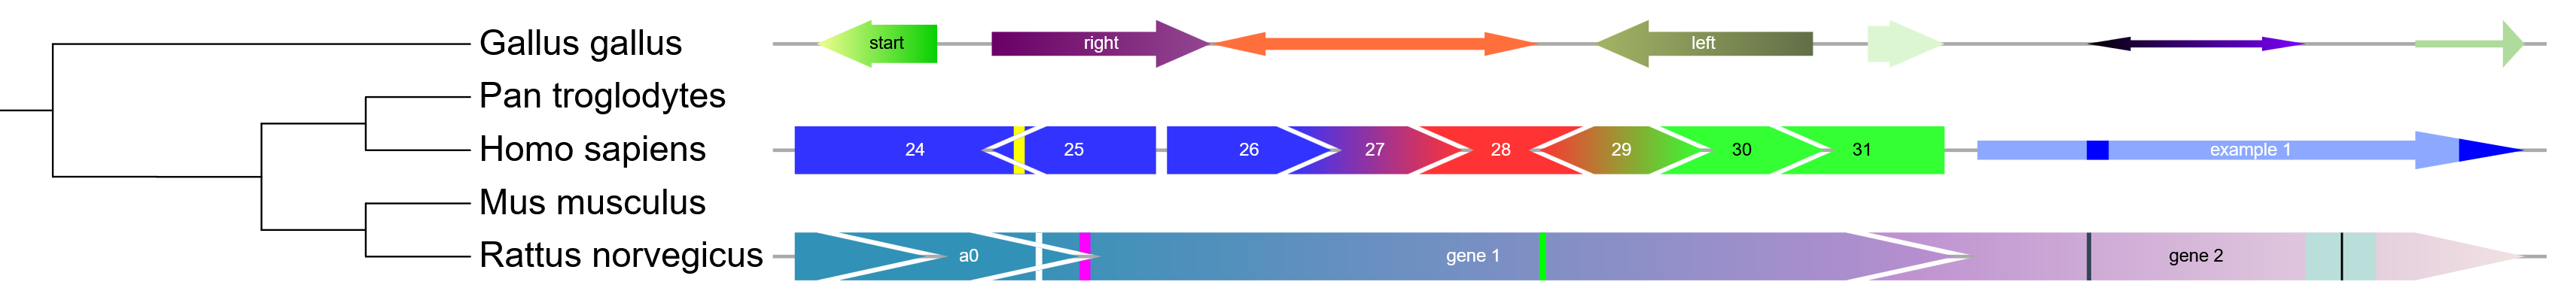
An example arrows dataset
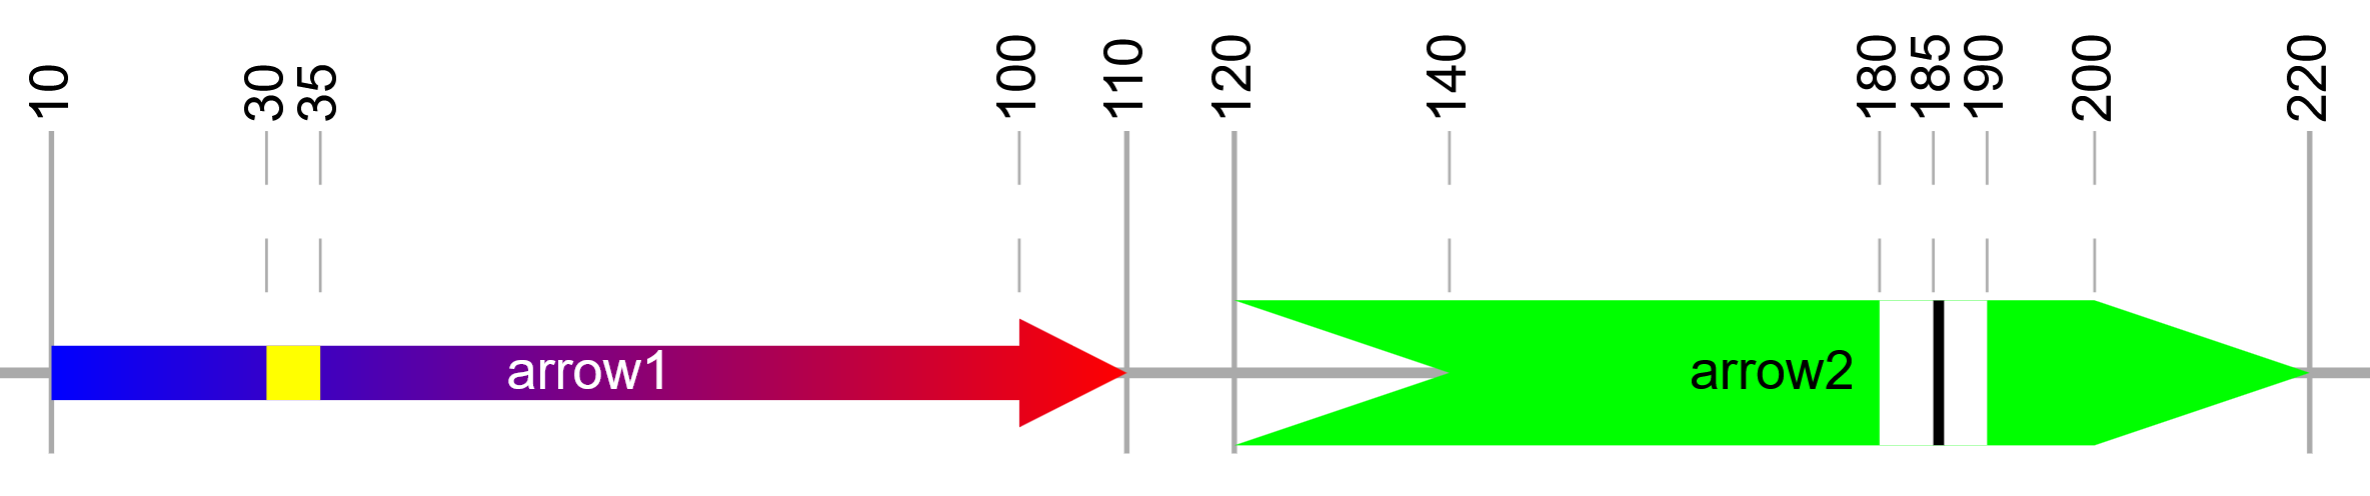
Two example arrows defined below
Arrow datasets are visualized as sets of arrows or rectangles outside the tree, with an optional backbone line/rectangle behind them. Their primary use is for the visualization of gene structures, but they offer a lot of flexibility due to many individual arrow parameters.
Arrows can be one sided or bidirectional, and their left or right head widths configured separately. Each arrow head can be inverted (by specifying a negative width value), and the connecting body height freely changed.
Each tree node can have one arrow set definition assigned, with the total backbone length defined in second field, followed by an unlimited number of individual arrow definition fields. Each arrow definition consists of 10 parts, separated with vertical lines:
START|END|START_COLOR|END_COLOR|LABEL|LABEL_COLOR|ARROW_HEIGHT_FACTOR|...
...BOX_HEIGHT_FACTOR|HEAD_WIDTH_LEFT|HEAD_WIDTH_RIGHT
The mandatory 10 arrow definition parts can be followed by any number of "mark" definitions, which are rendered as vertical bars within the arrow. Each mark definition consists of 3 parts, separated with vertical lines:
|START|END|COLOR
Example arrow definitions (shown in the bottom figure in the box above):
10|110|#0000ff|#ff0000|arrow1|#ffffff|0.75|0.5|0|10|30|35|#ffff00,120|220|#00ff00|#00ff00|arrow2|#000000|1|1|-20|20|180|190|#ffffff|185|186|#000000

1   2     3       4      5       6      7   8  9 10 11 12    13    1   2      3       4      5       6   7 8  9  10  11  12    13    14  15    16

First arrow:
fields 1 and 2 : position 10 to 110
fields 3 and 4 : filled with a gradient from blue (#0000ff) to red (#ff0000)
fields 5 and 6 : label text ('arrow1') in white (#ffffff)
fields 7 and 8 : arrow will use 75% of the height available (height factor 0.75),
                 and the arrow body will be 50% of the total height (box height factor 0.5)
fields 9 and 10: no arrow head on the left (0) and a 10 px arrow head on the right (10)
fields 11 to 13: vertical yellow (#ffff00) mark at position 30 to 35

Second arrow:
fields 1 and 2 : position 120 to 210
fields 3 and 4 : filled with green color (#00ff00)
fields 5 and 6 : label text ('arrow2') in black (#000000)
fields 7 and 8 : arrow will have the maximal height available (height factor 1),
                 and the arrow body will be 100% of the total height (box height factor 0.5)
fields 9 and 10: inverted 20px arrow head on the left (-20) and a 20 px arrow head on the right (20)
fields 11 to 16: 2 vertical mark definitions: white (#ffffff) at position 180 to 190, and black (#000000) at position 185 to 186
Shape plots 
Template file: dataset_external_shapes_template.txt
Supported by the iTOL annotation editor for spreadsheets
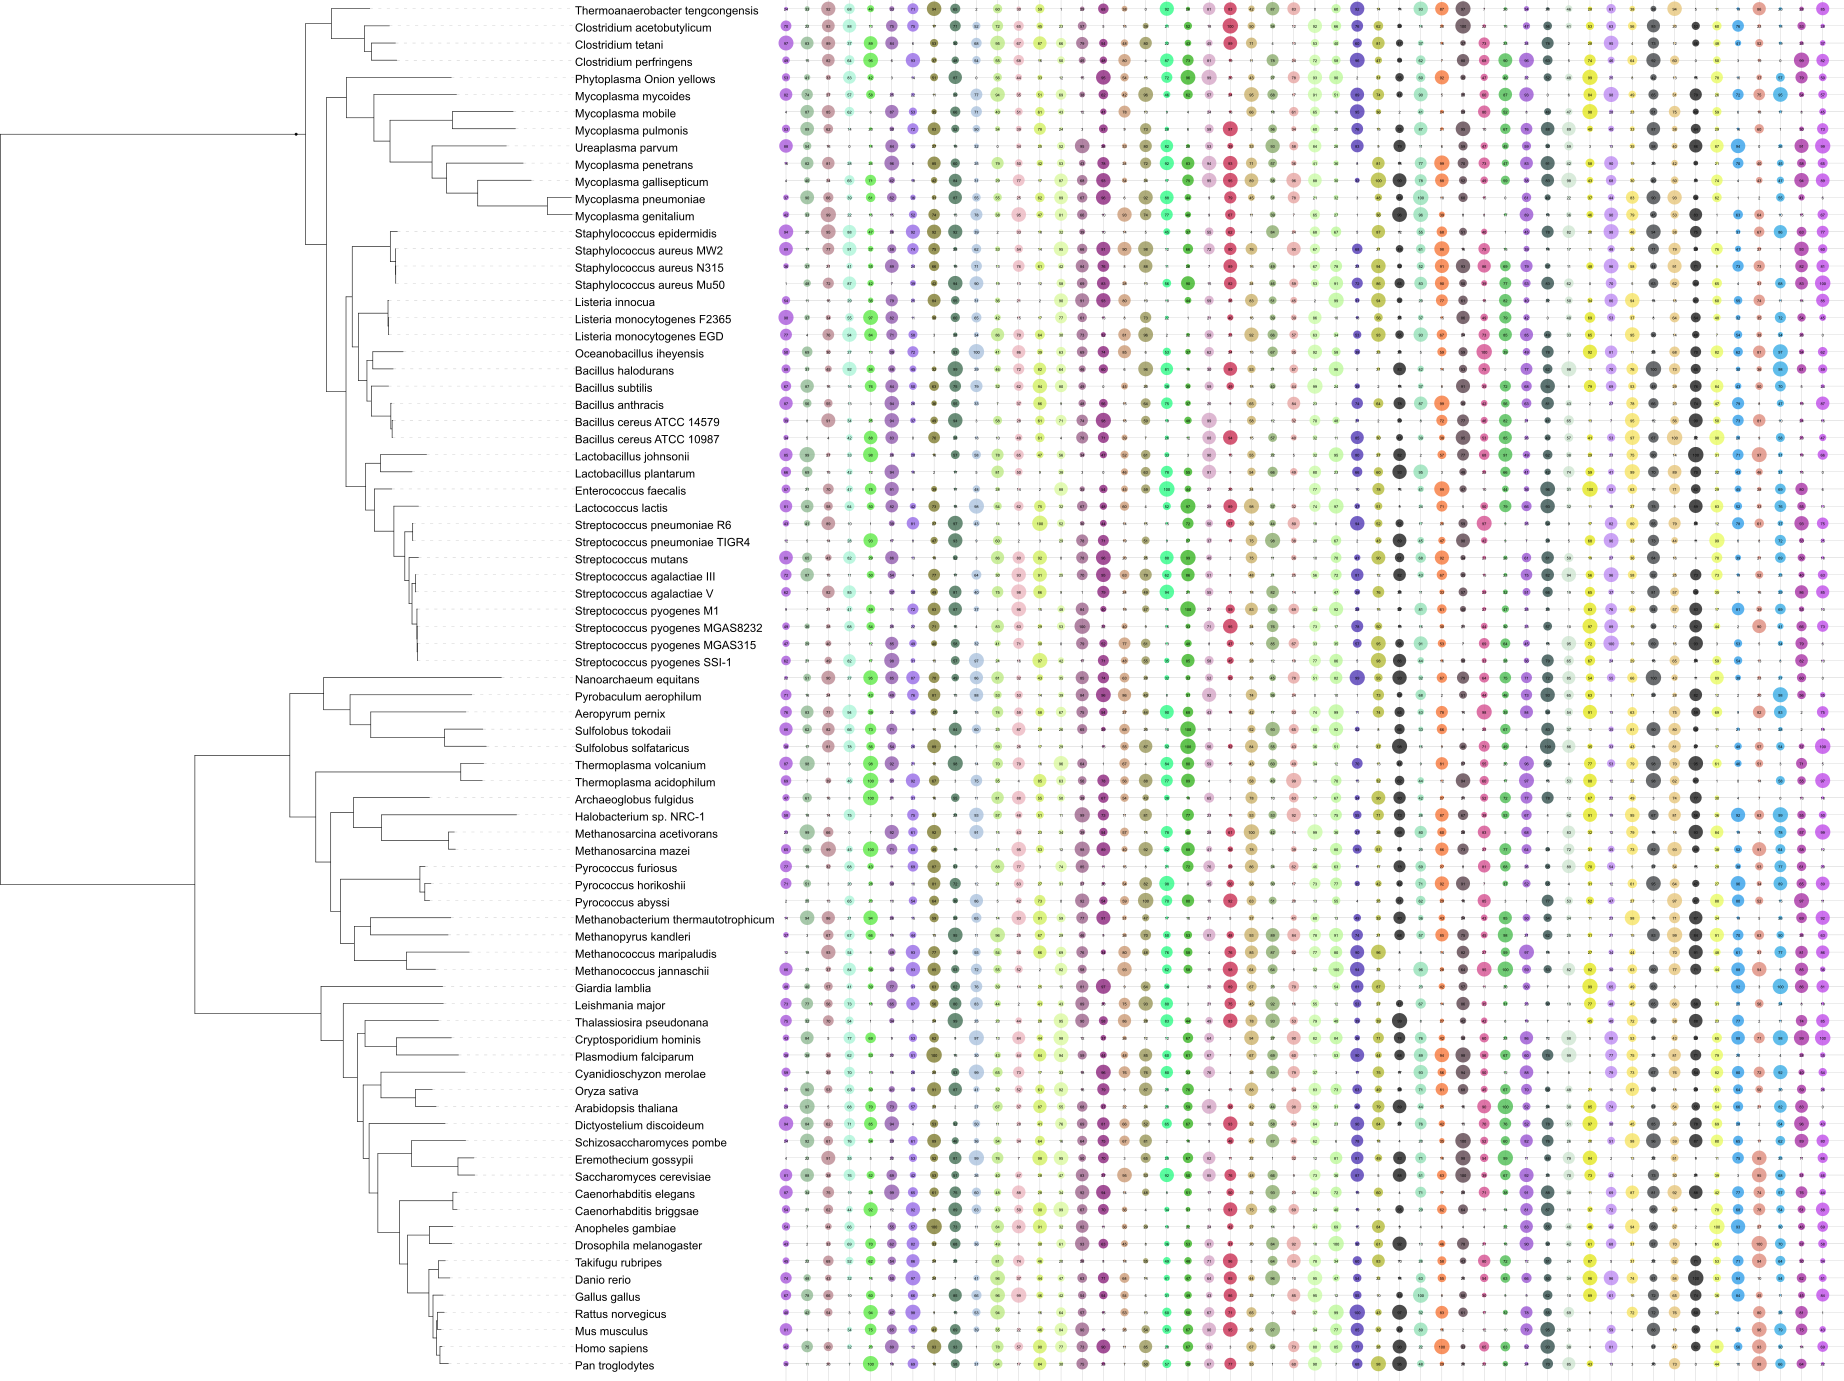
A dot plot with full grid and dataset values displayed
In shape plots, each tree node has multiple numeric values associated with it. The values are displayed as geometric shapes of different sizes in consecutive columns outside the tree. Highest value in the dataset will have the largest size, and all others will be scaled down proportionally.
Labels and colors for each column are defined in the FIELD_LABELS and FIELD_COLORS lines. Optionally, a grid can be rendered behind the columns and the actual values can be displayed above the shapes. The shapes can be either filled with the defined colors, or displayed as outlines.
Display shape is defined in the SHAPE_TYPE line, with a number between 1 and 5, and can be changed later through the dataset options control tab.
| 1 | square | |
| 2 | circle | |
| 3 | star | |
| 4 | right triangle | |
| 5 | left triangle |
Boxplots (box and whisker diagrams) 
Template file: dataset_boxplot_template.txt
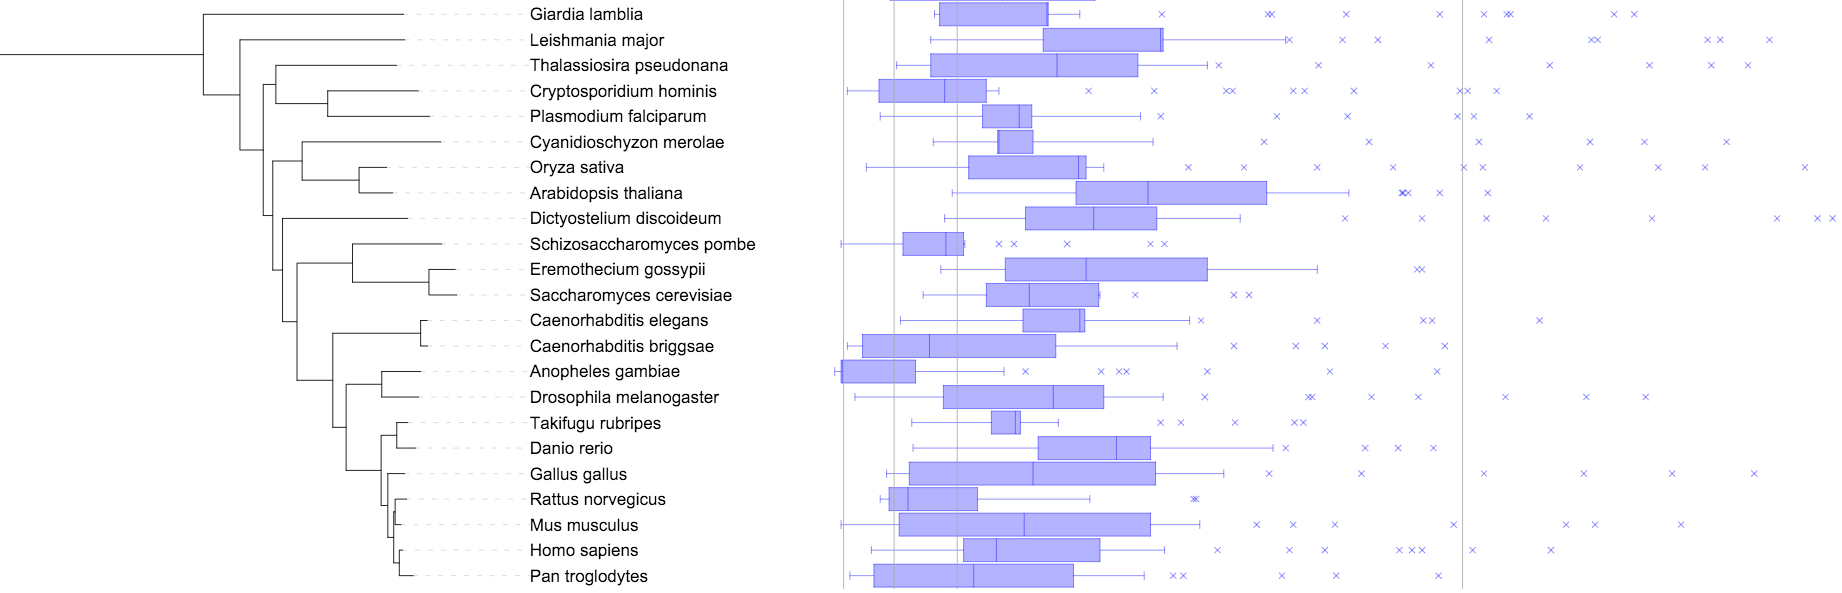
A boxplot dataset with a custom scale
Boxplots (box and whisker diagrams) display the distribution of data based on the five number summary: minimum, first quartile, median, third quartile, and maximum.
In addition to the five number box plot summary, each tree node can have an unlimited number of extremes defined, which will be displayed as crosses.
The largest value in the dataset (including extremes) will be at the position defined in the MAXIMUM_WIDTH field.
Phylogenetic placements
Template file: none, created automatically from .jplace files
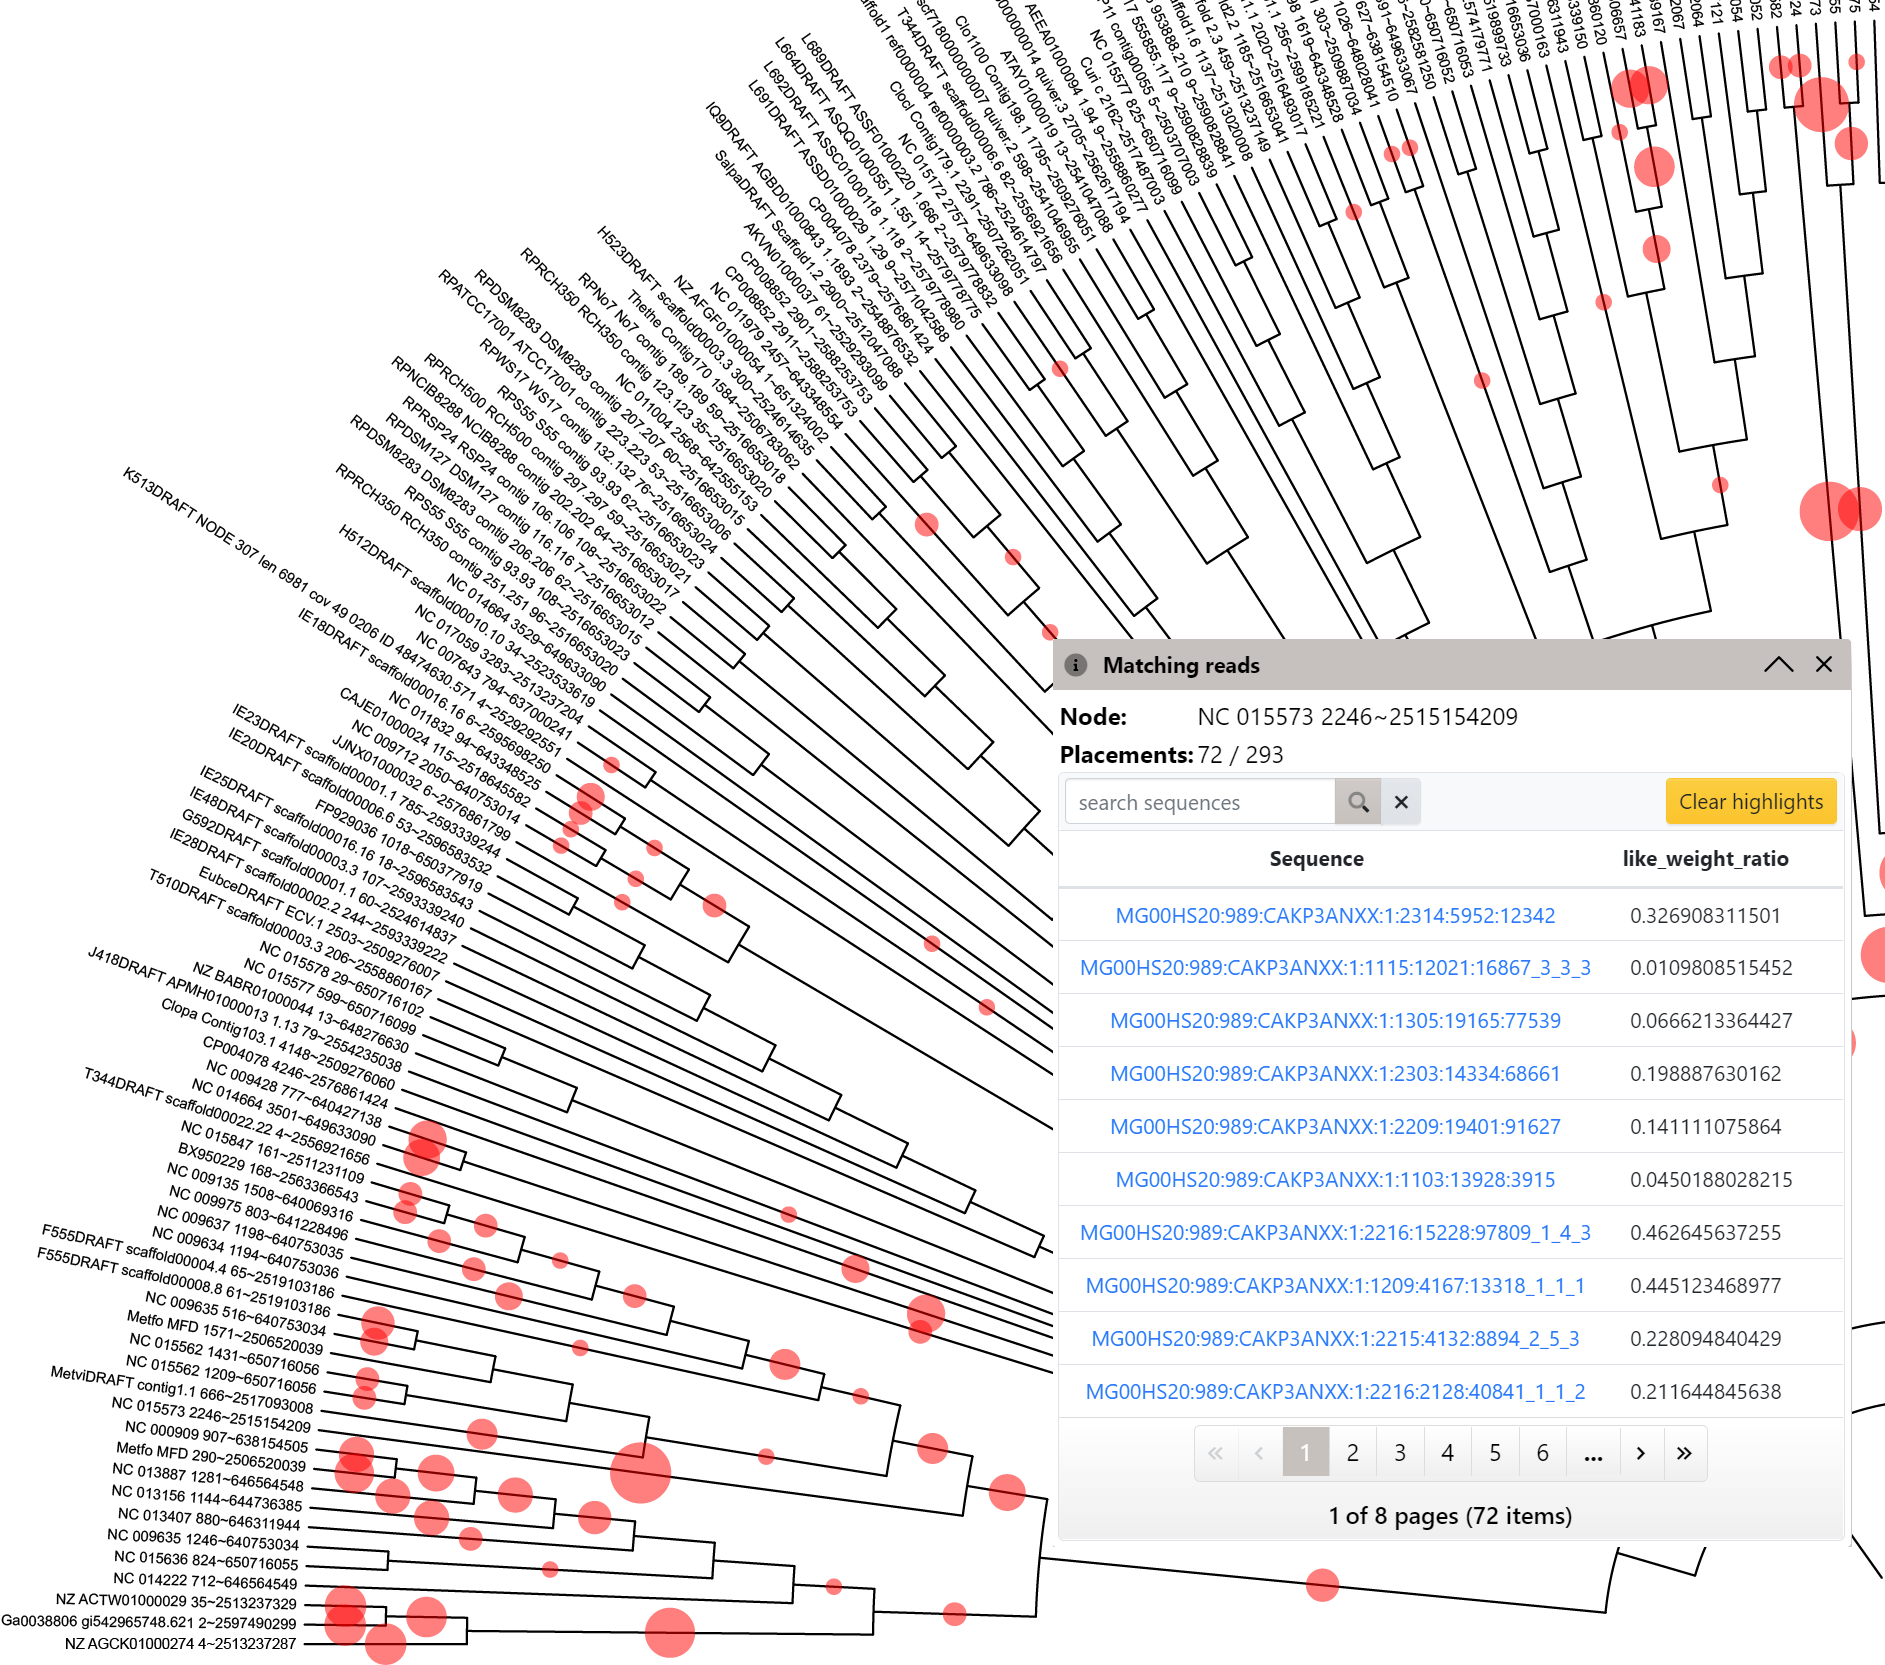
An example summary of phylogenetic placement data, with the full list of matching sequences in a branch
iTOL supports the visualization of .jplace files created by pplacer and RAxML. Simply upload a .jplace file as a any other standard tree. Note that the file extension must be .jplace, otherwise the file will not be correctly recognised.
iTOL will visualize the Newick tree contained in the file, and the phylogenetic placement information will be extracted as a separate dataset. Summary of placements will be automatically created, and can be visualized in various ways by changing the Summary type in the dataset options tab of the control panel.
When summaries are displayed as symbols, click any symbol to display a full list of sequences mapped to it. Clicking on a sequence name in the table will highlight all other branches where it was placed.
Individual sequences can be searched and highlighted through the Query placements form. In the search results list, simply click any sequence to highlight its placement positions. Highlight symbols will be positioned according to the distal_length and sized according to the like_weight_ratio values. Multiple sequences can be highlighted at the same time, using different symbols and colors. Use the Clear highlights button to remove all highlights from the tree.
Multiple sequence alignments 
Template file: dataset_alignment_template.txt
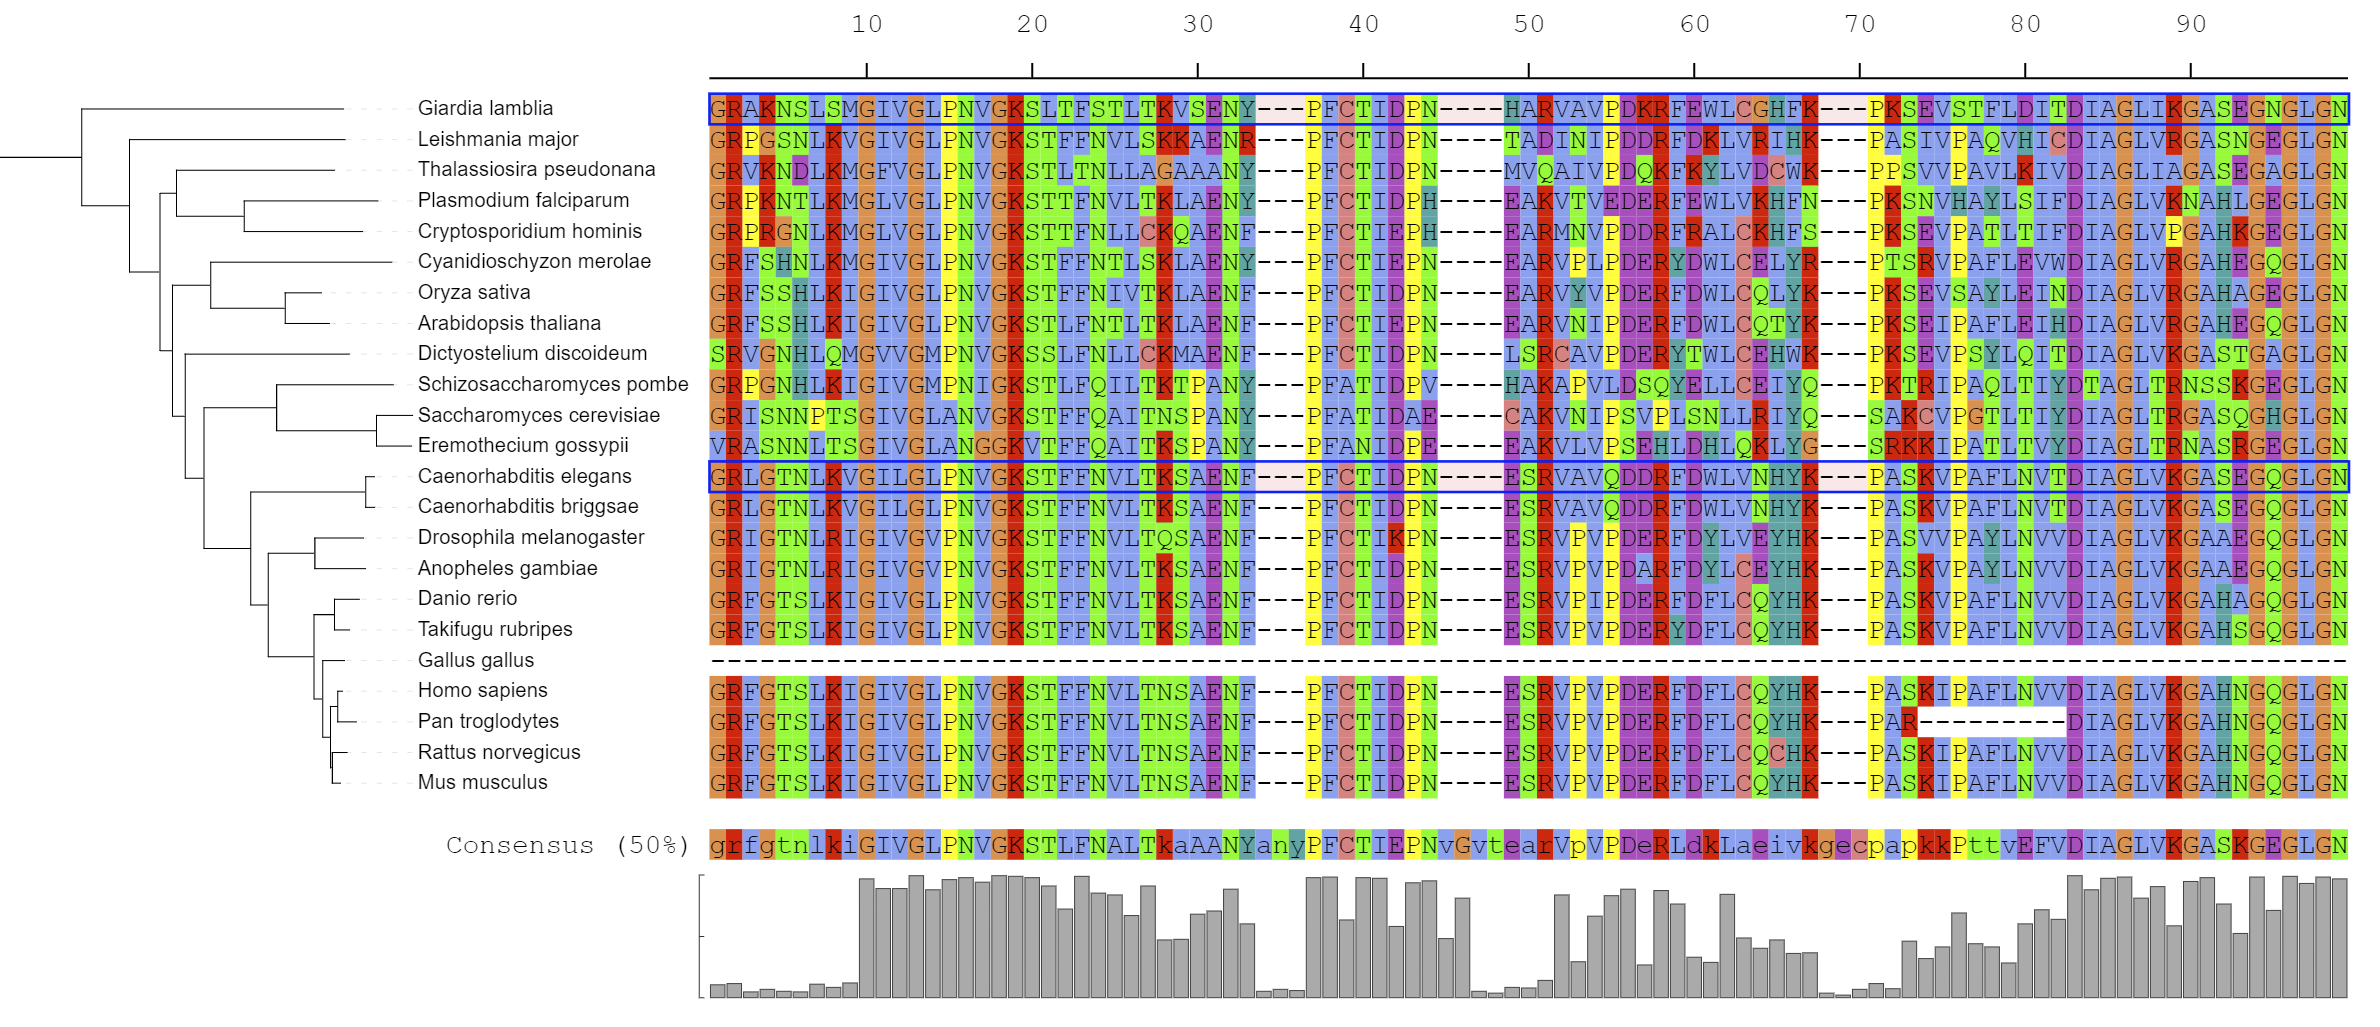
An example multiple sequence alignment visualized on a tree, with 2 reference sequences highlighted
This dataset type allows the visualization of multiple sequence alignments directly next to the tree. The alignment should be in FASTA format, and must be placed below the DATA keyword in the template file.
Consensus sequence (at 50% conservation) and residue conservation will be calculated automatically. The threshold for consensus calculation can be changed by using the CONSENSUS_THRESHOLD parameter. To ignore any gaps in the alignment when calculating the consensus, set IGNORE_GAPS to 1.
Residues in the alignment can be highlighted as dots, by using the HIGHLIGHT_TYPE field. When set to consensus, each residue will be displayed as a dot if it does not match the consensus sequence. By setting the HIGHLIGHT_DISAGREEMENTS field to 1, matching residues will be displayed as dots instead.
When HIGHLIGHT_TYPE is set to reference, residues will be compared to the reference sequences defined in the HIGHLIGHT_REFERENCES filed. HIGHLIGHT_REFERENCES is a list of one or more tree leaf IDs which will be used as references in the alignment. If only one reference is defined, all residues will be compared to it directly. If multiple references are defined, each sequence will be compared to the first reference sequence above it in the alignment. Note that the top leaf should also be included in the references in this case.
When defined, reference sequences can be marked with boxes by setting MARK_REFERENCES to 1.
In addition to the most common alignment coloring schemes, it is possible to define custom schemes through the 'CUSTOM_COLOR_SCHEME' option in the dataset template. Multiple custom color schemes can be defined, and they will all be listed in the color scheme selection box in the dataset options tab.
Displaying large alignments (sequences with more than 1000 - 2000 residues) will severely impact performance, please be patient when manipulating the tree display. Due to internal browser limits, alignments blocks that can be displayed are limited to approximately 4000 residues.
Timescales 
Template file: dataset_timescale_template.txt
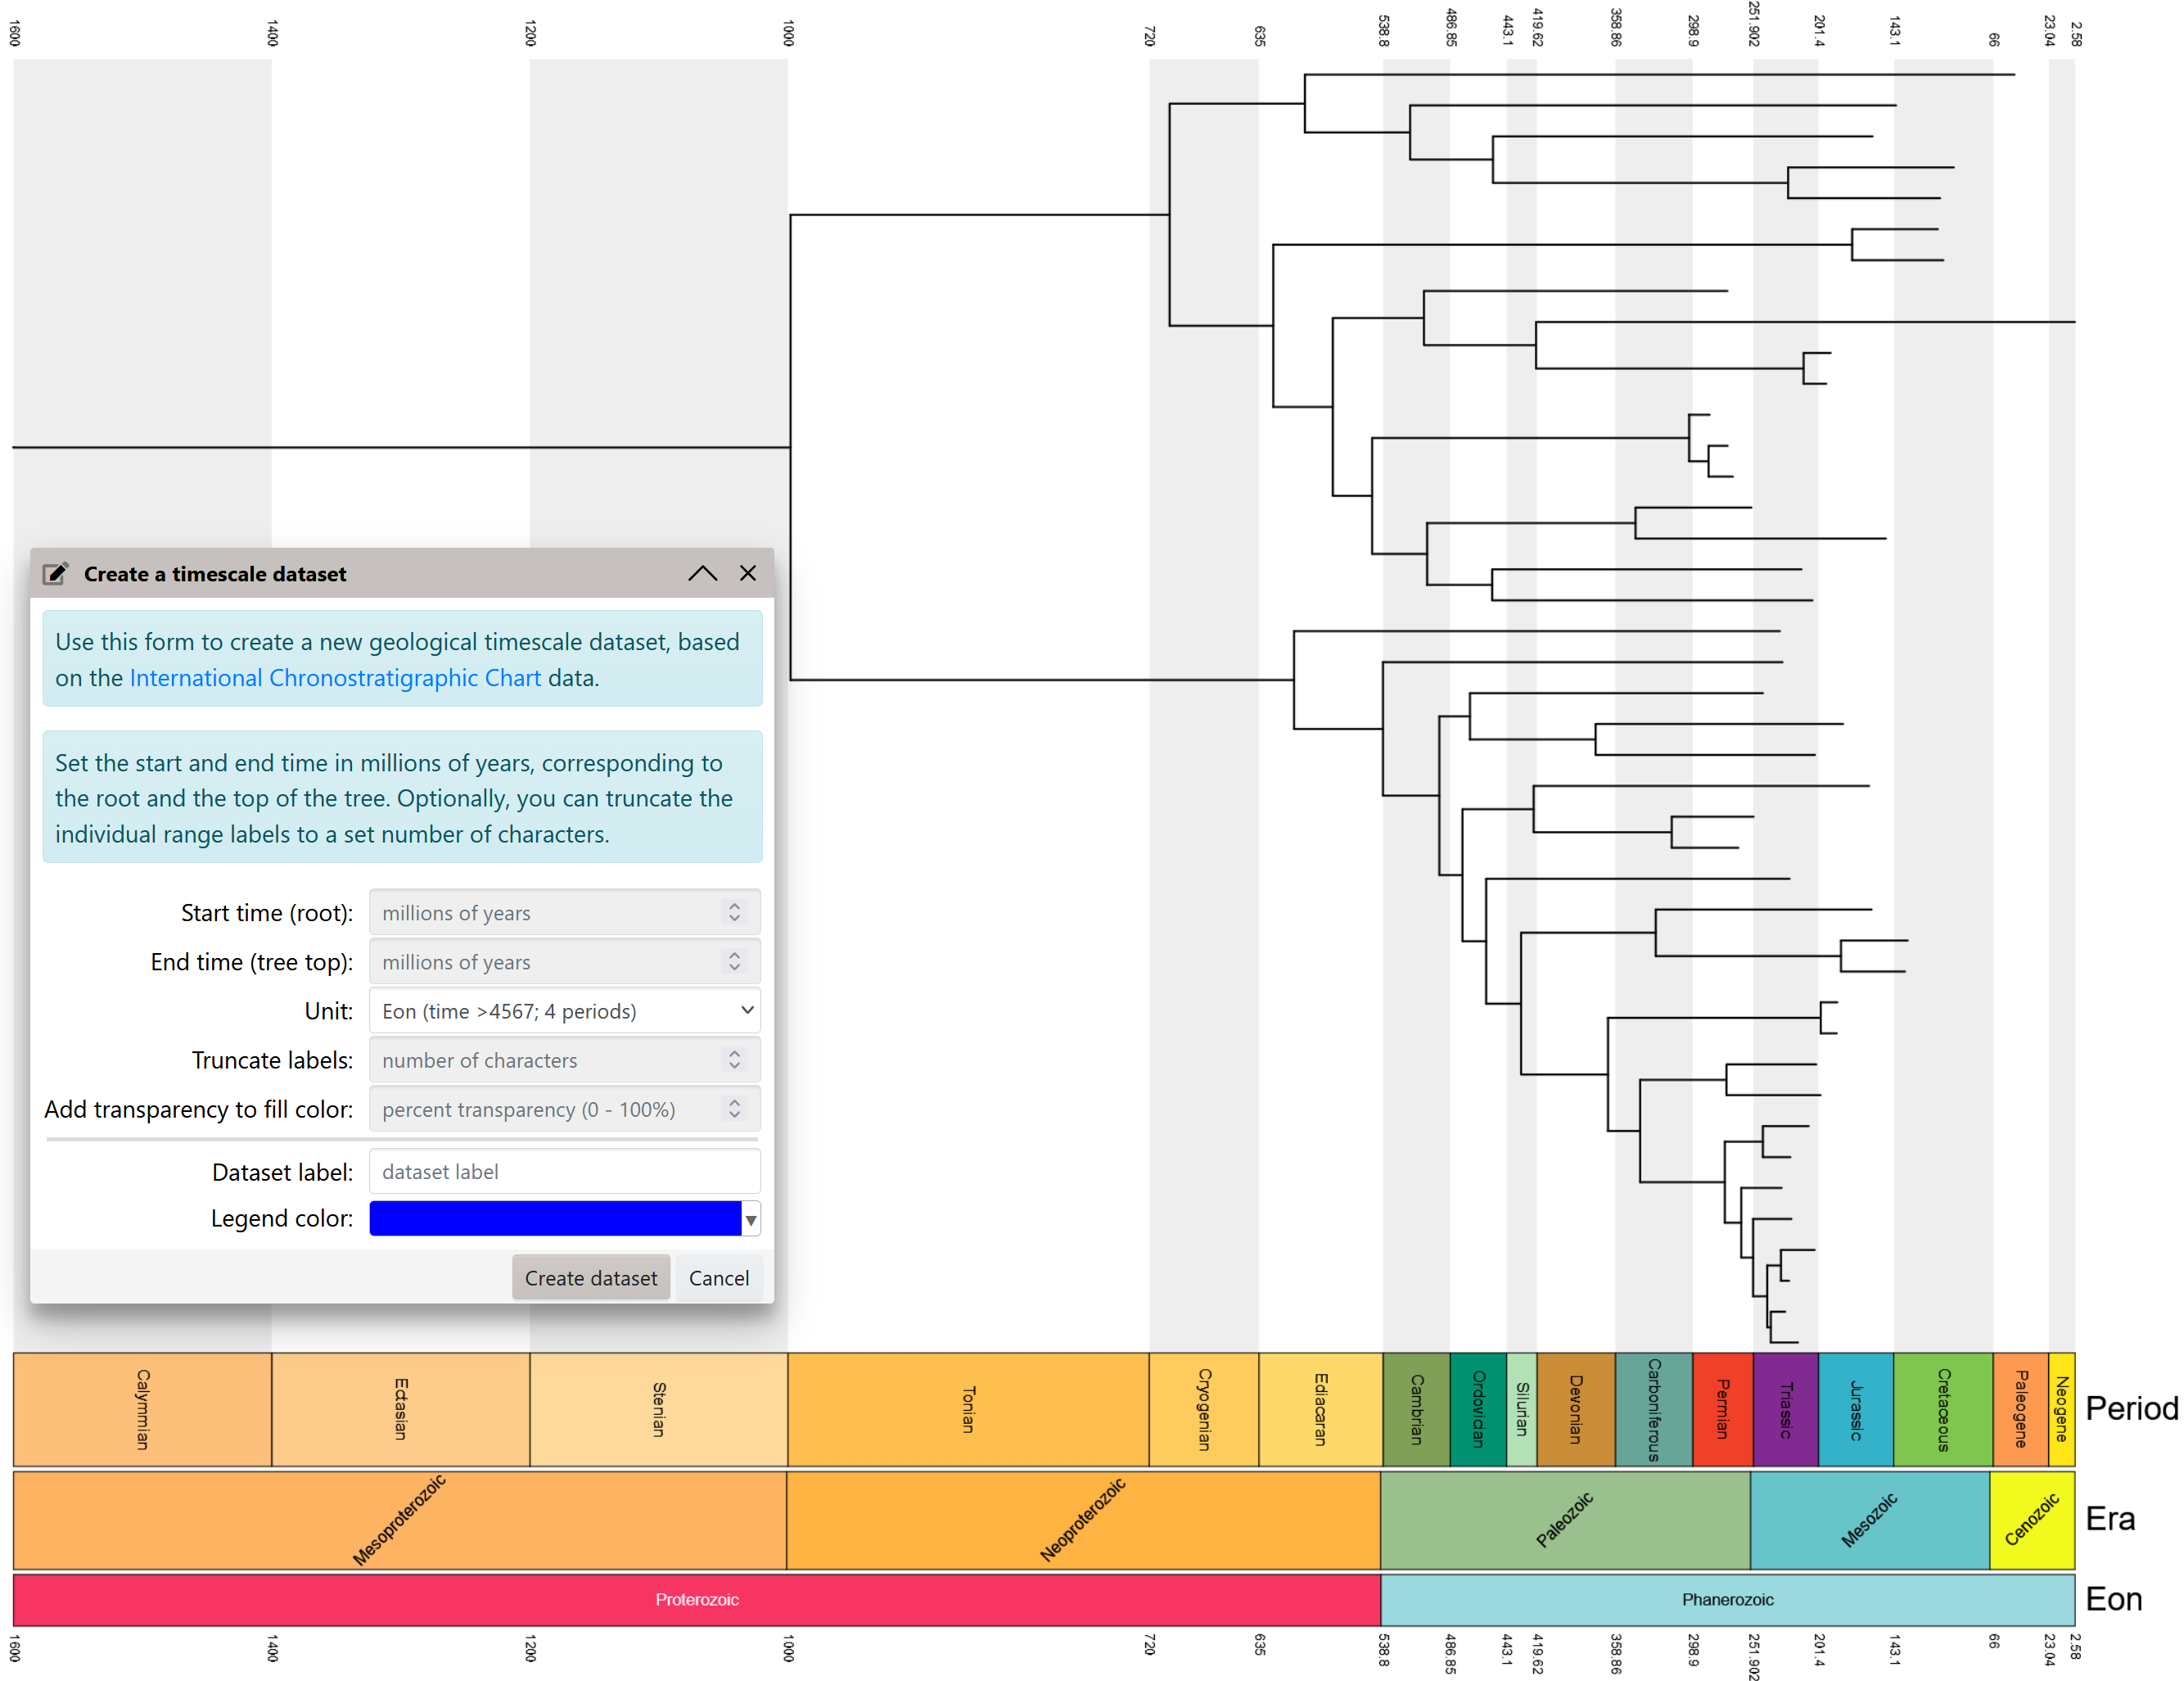
Several automatically generated geological timescales
This dataset type allows the visualization of timescales below the tree structure. Each time range in the scale is defined with a start and end value, which can be any number. Zero (or lower values) correspond to the tree top, and the values increase towards the tree root.
The correlation factor between the tree branch lengths and the time range values used in the dataset is set through the SCALING_FACTOR parameter. Tree branch lenghts are multiplied with this factor to determine the position of the time ranges defined in the dataset. If the SCALING_FACTOR is 1, values in the dataset are interpreted directly as branch lengths. The scaling factor can be calculated automatically by using the AUTO_SCALE parameter, or updated later (if the tree strucutre was changed, e.g. by pruning) by clicking the corresponding button in the dataset options (in the Scaling factor row).
Timescales can be visualized below the complete tree structure by setting the COVER_TREE parameter to 1. If you only want to display the timescale grid, without the colored boxes, set the SHOW_RANGES parameter to 0.
Automatic creation of geological timescales
In addition to the manual timescale creation via templates or the editor, these can be generated automatically from the International Chronostratigraphic Chart data. Click the button in the Other functions section of the advanced control panel tab to access the timescale creation dialog. Set the times for the tree top and root (in millions of years), and select the desired resolution unit (Eon, Era, Period, Epoch or Age).
If the names/labels for various time periods are too long, you can truncate them automatically by setting the desired length in the Truncate labels field.
If you want to change the colors or labels, the automatically generated dataset can be updated via the web editor.
Manual annotation and drawing tools
Template file: none, created interactively using the drawing/annotation tools
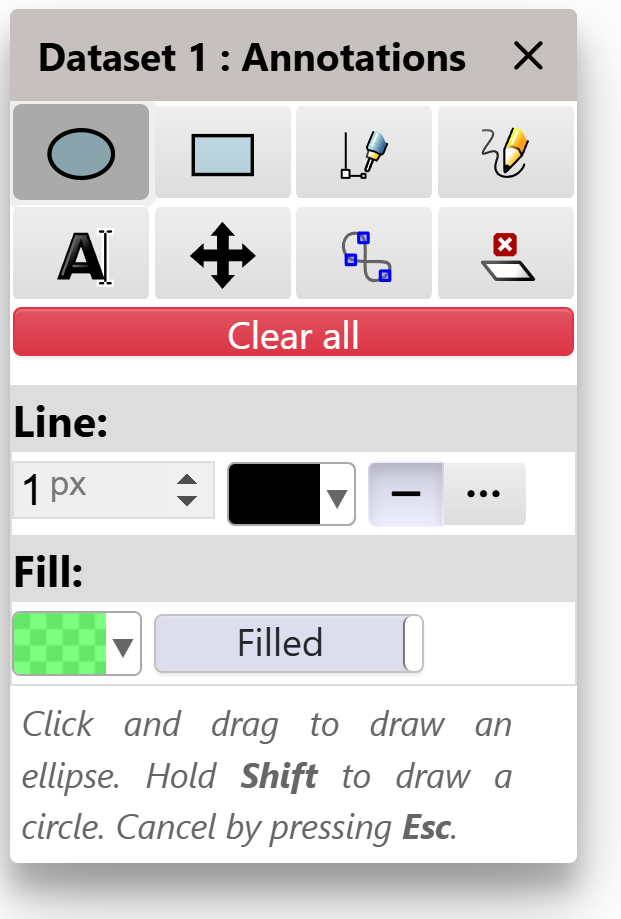
Manual annotation tool panel
iTOL provides a set of very simple drawing tools which allow adding basic manual annotations to trees. These are not intended to be used for any complex drawing / annotation, you should use a proper vector graphics editor if required.
After creating the dataset through the button, click the in the dataset settings to open the tool panel, then click any of the tool buttons to select it. The following tools are available:
 Ellipse/circle: click anywhere in the tree to set the center, and drag to draw an ellipse. Keep the Shift key pressed to draw a circle.
 Rectangle/square: click anywhere in the tree to set the top left corner, and drag to draw a rectangle. Keep the Shift key pressed to draw a square.
 Line/shape: click anywhere in the tree to set the starting point. Click elsewhere to draw a line, or click and drag to draw a Bezier curve. Keep clicking to continue adding lines / curves. Press the Enter / return
key to complete the line/polygon, or click the starting point to complete the shape.
Line/shape: click anywhere in the tree to set the starting point. Click elsewhere to draw a line, or click and drag to draw a Bezier curve. Keep clicking to continue adding lines / curves. Press the Enter / return
key to complete the line/polygon, or click the starting point to complete the shape. Freehand drawing: click anywhere in the tree to set the starting point, and drag to draw.
 Text label: click anywhere in the tree set the label position, and enter the text when prompted.
 Move/rotate/scale: click any existing manual drawing or text label, and drag it to a new position. While dragging the mouse, keep the Shift key pressed to rotate. Keep the Ctrl
key pressed to scale the object horizontally, or keep the Alt / Meta key pressed to scale it vertically.
Hold both Ctrl and Alt/Meta keys to scale uniformly.
Move/rotate/scale: click any existing manual drawing or text label, and drag it to a new position. While dragging the mouse, keep the Shift key pressed to rotate. Keep the Ctrl
key pressed to scale the object horizontally, or keep the Alt / Meta key pressed to scale it vertically.
Hold both Ctrl and Alt/Meta keys to scale uniformly. Edit objects: When this tool is selected, all manually drawn paths and objects will be highlighted. Click and drag any path point to move it. Click and drag the point handles to adjust the curves.
 Delete objects: click any object or text label to delete it.
- Clear all : remove all annotations defined in this dataset.
Note that all manual annotation positions and sizes are specific for the current tree display. If you change the display mode, or change the tree structure, the annotation positions will NOT change accordingly.
MEME motifs 
Template file: none, created automatically from MEME suite .xml files
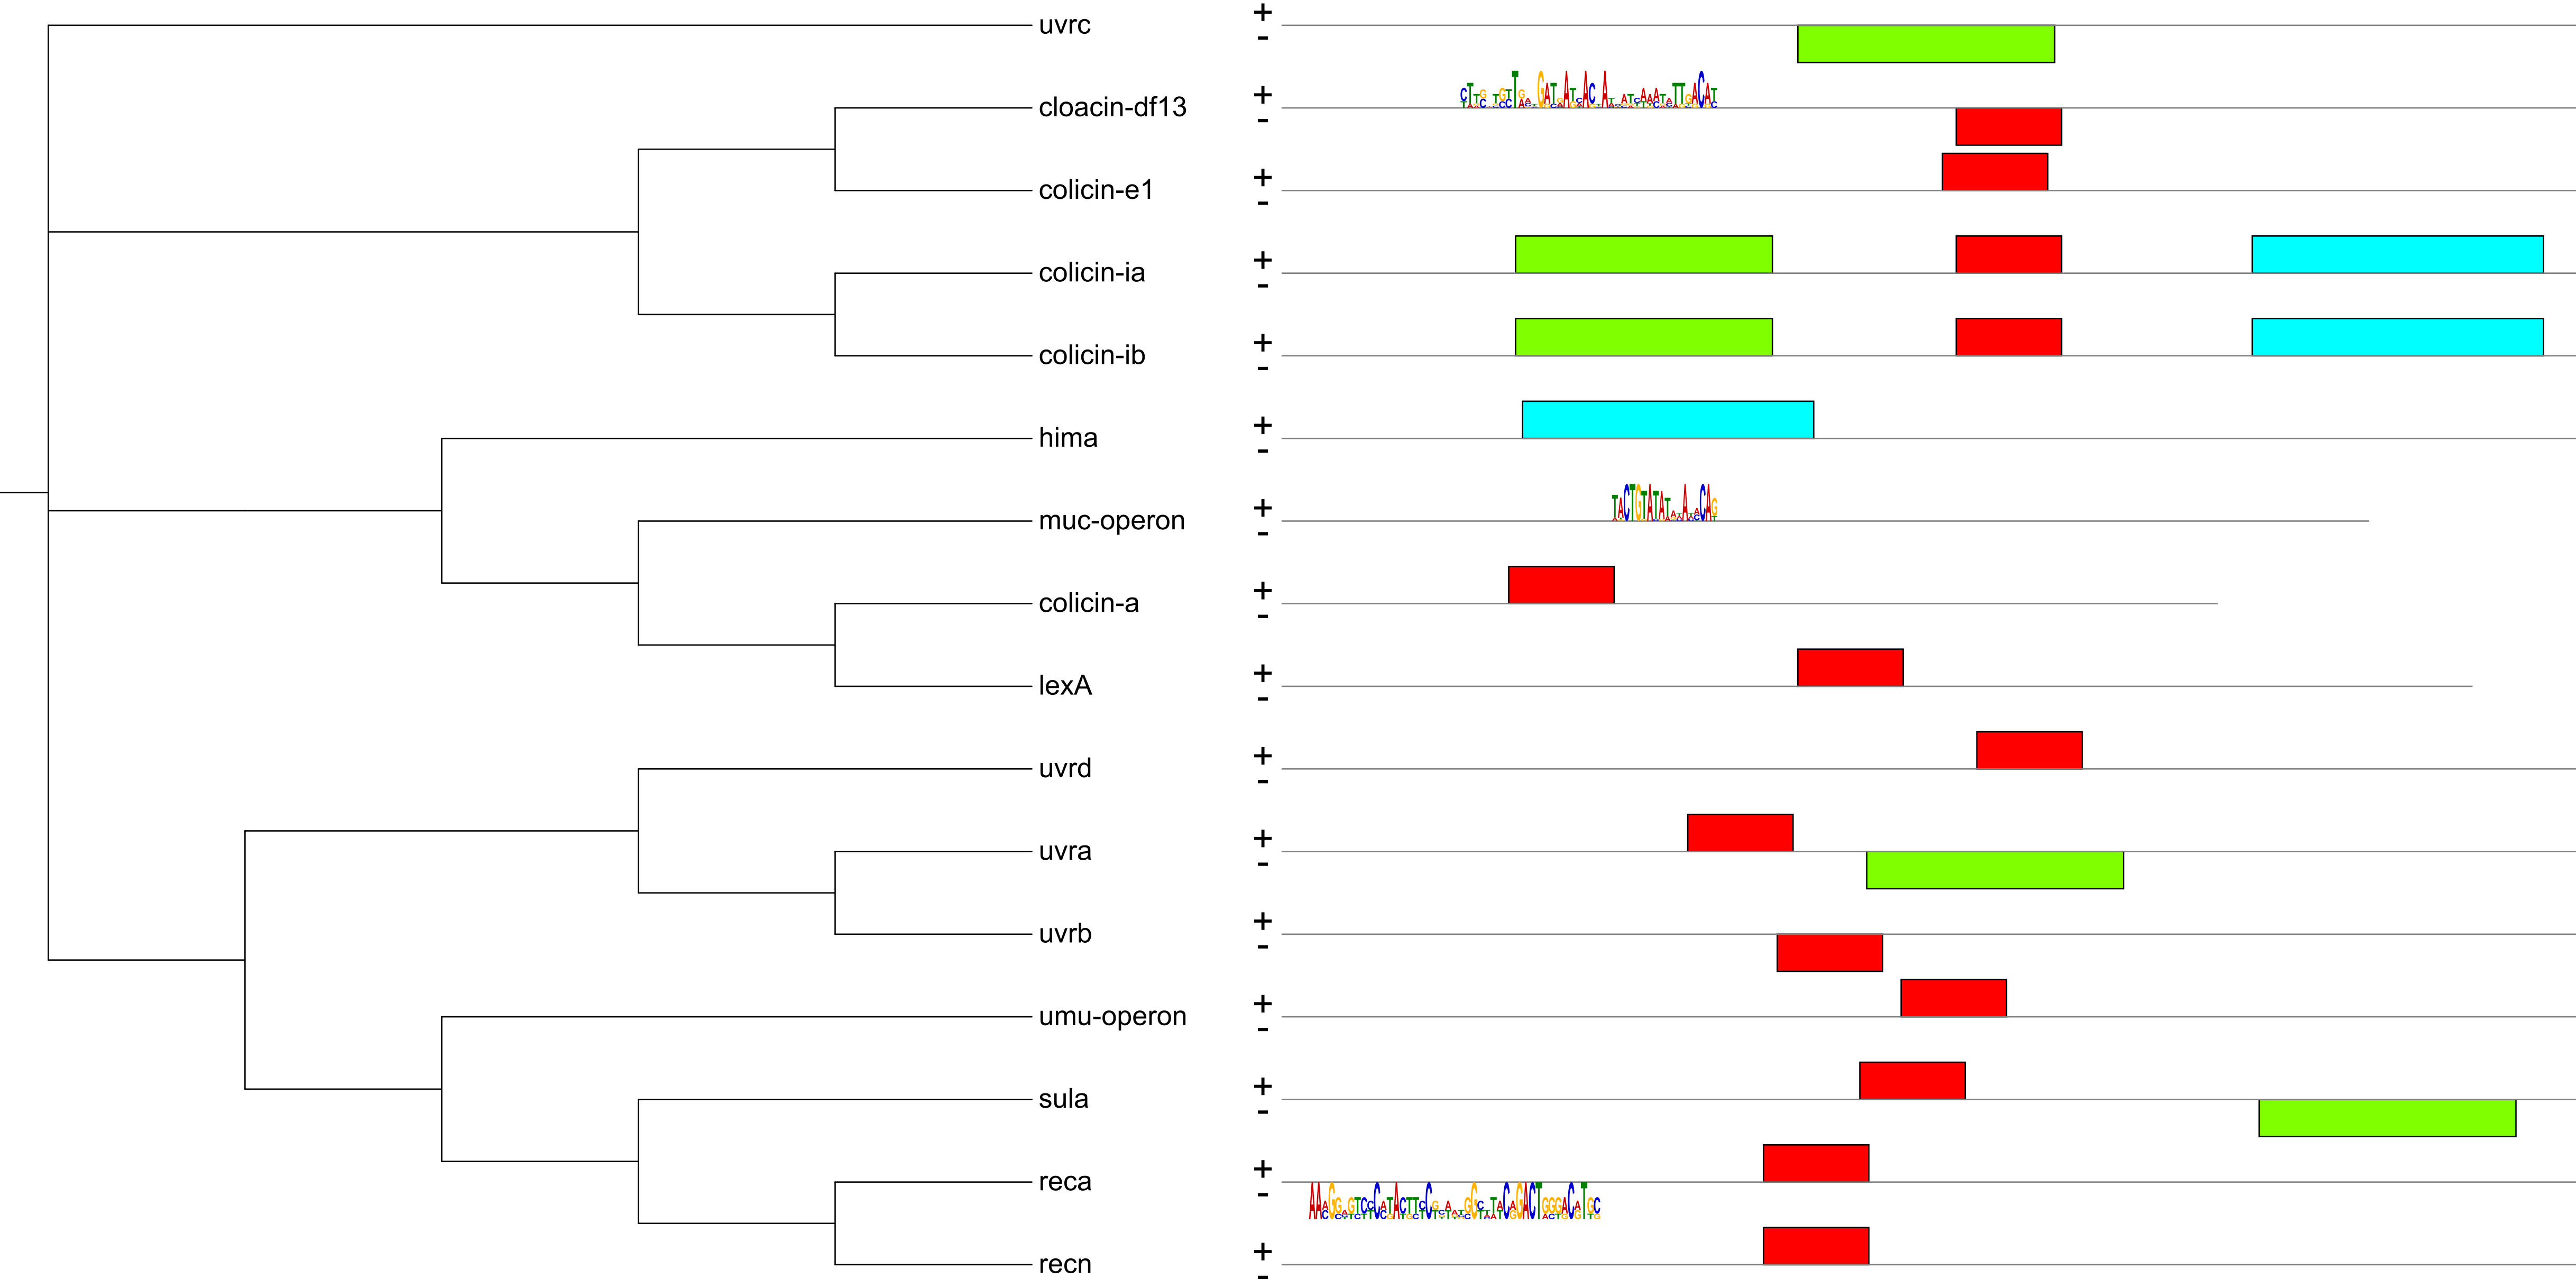
An example visualization of MEME suite analysis. Some motifs are displayed as MEME motif logos.
iTOL supports the visualization of .xml files created by the MEME suite. Simply drag and drop a MEME .xml result file onto the tree display. Note that the tree leaf IDs must match the sequence IDs in the MEME results.
Motifs will be visualized similarly to the 'Motif Locations' section of the MEME HTML output files. If strand information is present, motifs will be visualized above and below the backbone line, depending on their strand.
Hover over any motif to display a popup window with basic information about it, including the sequence and other details. Click on any motif to switch between the simple box representation and the motif logo display. You can increase the height of the motif logo display through the dataset settings, so it spans both strands instead of just one.
Images
Template file: dataset_image_template.txt
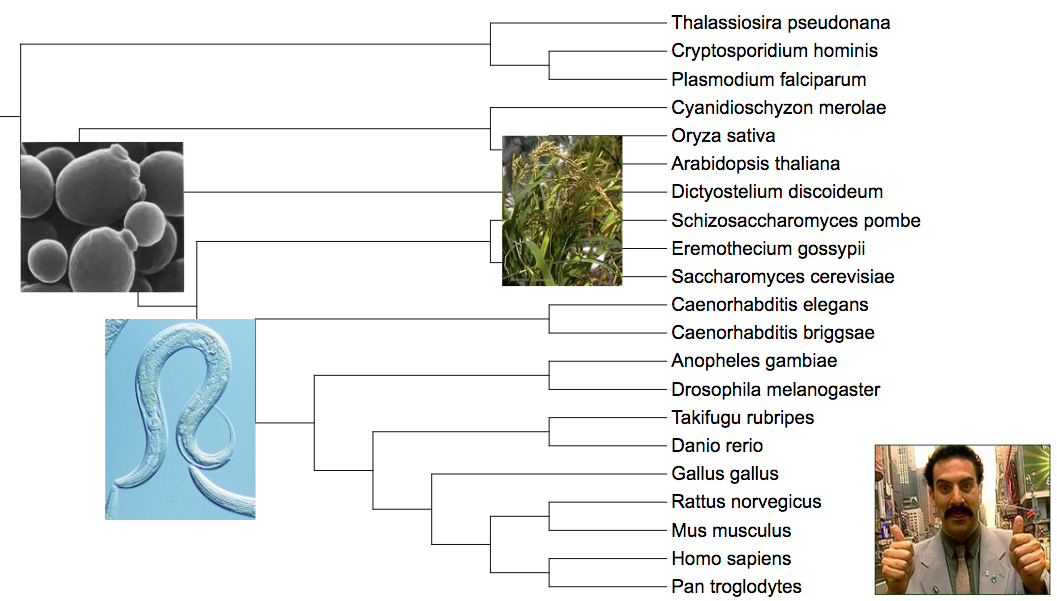
Several bitmap images displayed directly on the tree
Use this dataset template to add various external images onto the tree. Each node in the tree can be associated with a bitmap (any format supported by your browser) or a vector image (SVG).
Images can be displayed internally on the tree branches, or outside the tree. In addition, each image's scale and position can be individually adjusted.
Image URL has to be specified in full (including the protocol, e.g. http://), and the images have to be accessible via that URL by your browser. They are not accessed by iTOL directly, unless you export the tree into any format other than SVG.
Line charts
Template file: dataset_linechart_template.txt
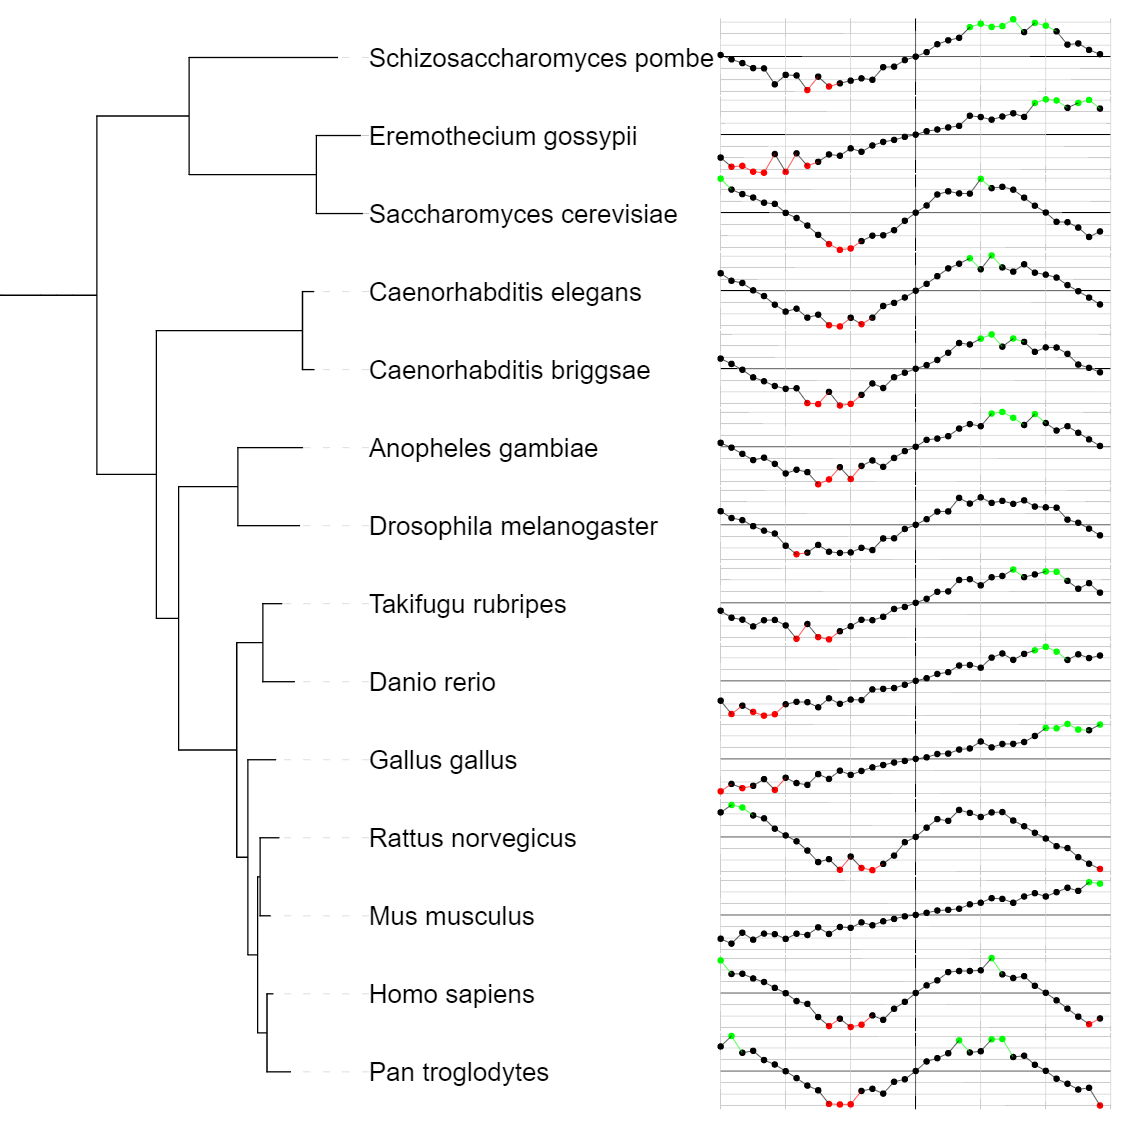
Horizontally displayed line chart with custom axes grid and 3 color ranges for Y values
Use this dataset template to visualize line charts. Each node in the tree is associated with a series of points, defined with their X and Y coordinates. Line charts can be displayed horizontally or vertically next to the nodes. To increase the spacing between the tree leaves (and make more space available for the charts), use the tree Scaling factors on the Advanced controls tab.
Custom axes grids can be defined through the fields AXIS_X and AXIS_Y. Each line's color and width can be separately defined. AXIS_X will draw horizontal lines (i.e. values correspond to Y values), while AXIS_X will draw vertical lines (i.e. values correspond to X values)
Each line chart can be displayed using dots, lines or both. Default colors for dots and lines can be defined separately.
In addition, a series of color ranges can be defined using the field LINE_COLORS (see below). Each range consists of a Y value and the color, separated using a vertical line. For each point in the dataset, the first LINE_COLORS color whose value is above the point's Y value will be used to color the dot and line extending from it
In the example below, Y value of -10 would correspond to red (#ff0000), Y value of 2 would be black (#000000) and a value of 10 would be green (#00ff00)
LINE_COLORS -4|#ff0000 4|#000000 100|#00ff00
Creating figures and tree export
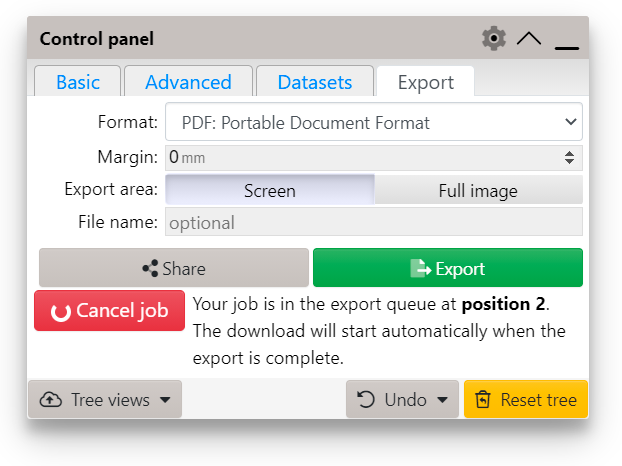
Tree export options
Use the Export tab of the control panel to access the the tree export functions. Depending on the export format selected, several additional options are available:
- Export area : if set to Screen, the exported figure will match your current browser viewport exactly. If you want to export the whole tree which does not fit on the screen, set this option to Full image
- Margin : Specify an additional margin to be added around the tree
- Resolution : Used for bitmap/PNG export only, specifies the image resolution in dots per inch (DPI)
- Internal node IDs: When exporting to text formats, you can opt to include or exclude internal node identifiers (if these are present in the tree)
- File name: If you do not specify a file name, a random string will be used.
When exporting bitmap or vector images (other than SVG), your job will be added to the export processing queue. Once the export is completed, the download will start automatically.
If you use the exported figures in a publication, please cite the latest iTOL paper if possible.
In addition to the standard figure export, you can click the Share button to create a shared export. The exported figure will be associated with the tree and stored on the iTOL server for one year. Send the tree ID to your collaborators, and they can type it into the box on the top of the data sharing page to access all the shared exports for that tree.
To delete shared exports, visit the Export management page which will show all your shared exported figures. All shared exports expire automatically after one year.
Tree shared exports can also be accessed through a simple URL:
https://itol.embl.de/export/treeID
Batch access
iTOL supports batch tree upload and export through a simple CGI interface. We are providing it for advanced users who want to upload or export their trees directly from other scripts/programs. Please be considerate to other users if you're using this method to access iTOL. Make sure to wait at least a few seconds between requests, particularly if exporting to PNG.
Example uploader and downloader Perl scripts are available for download. Check the external tools section for alternative options.
Batch upload
URL : https://itol.embl.de/batch_uploader.cgi
To use the batch upload, you must have an active standard subscription.
iTOL batch uploader is a standard CGI script, available at https://itol.embl.de/batch_uploader.cgi. Use a standard POST request to submit your data. Available parameters are described below. The script will produce plain text output (Content-type text/plain), as follows:
- An error occurred during upload: first line will start with the keyword ERR, followed by a numeric error code and a longer description
- Upload was successful, without warnings: first line will start with the keyword SUCCESS: , followed by a space character and the numeric iTOL tree ID
- Upload was successful, warnings occurred: warnings will be printed one per line, and the last line will start with the keyword SUCCESS:, followed by a space character and the numeric iTOL tree ID. If your upload was successful, store the returned iTOL tree ID for further use. You can access the tree at the URL https://itol.embl.de/tree/TREE_ID, or use the batch export script described below.
Batch uploader options
Required parameters
- zipFile
-
a ZIP archive containing the tree and all other dataset and annotation files. Your tree file must have the extension .tree, .tree.txt or .jplace. All other files can be named as you wish. When the files are processed during upload, they will be sorted by name, allowing you to order the datasets (if required).
- APIkey
- Your API key, which can be generated on the user information page.
- projectName
- Project name is case-sensitive, and should be unique in your account. We recommend creating a separate project for batch uploaded trees.
Optional parameters
- treeName
- If treeName is not provided, the tree file name will be used instead.
- treeDescription
- If provided, the description will be shown in your account page
Batch delete
URL : https://itol.embl.de/batch_delete.cgi
Note that tree or project deletion cannot be undone.
iTOL batch delete is a standard CGI script, available at https://itol.embl.de/batch_delete.cgi. Use a standard POST request to submit your data. Available parameters are described below. You can delete individual trees (by using the tree parameter), or complete projects (by using the project parameter). The script will produce plain text output (Content-type text/plain), as follows:
- An error occurred during upload: first line will start with the keyword ERR, followed by a numeric error code and a longer description
- Deletion was successful: first line will start with the keyword SUCCESS
Batch delete options
Parameters
- APIkey
- Your API key, which can be generated on the user information page.
- tree
- Numeric iTOL tree ID, as provided by the batch uploader. Tree will be deleted from your account.
- project
- Project name is case-sensitive. The project and all its trees will be deleted. If multiple projects have the same name, only one will be deleted (randomly).
Batch export
URL : https://itol.embl.de/batch_downloader.cgi
A subscription is not required to use the batch downloader.
iTOL batch downloader is a standard CGI script, available at https://itol.embl.de/batch_downloader.cgi. Use a standard POST or GET request when submitting your download parameters. Available parameters are described below. The script will generate output as follows:
- An error occurred during export: Output will in Content-type: text/html, and the error will be printed.
- Export was successful: Output will be in the Content-type matching your selected format (image/svg+xml for SVG, image/png for PNG, application/postscript for PS and EPS and application/pdf for PDF). Make sure your downloader handles the incoming binary data properly.
Batch export options
Required parameters
- tree
-
iTOL tree ID which will be exported
- format
- Output file format. The following values are supported:
- Graphical formats: svg, eps, pdf and png
- Text formats: newick, nexus and phyloxml
Optional parameters
If you don't specify one of the optional parameters, values which are saved as the defaults for the tree will be used (or standard iTOL defaults, if none were saved). Apart from newick_format, all parameters are used only during export to graphical formats. If you require an option which is available in the iTOL web interface, but is missing from the list below, contact us.
- newick_format
- Possible value: ID. Only used when export format is set to newick. If specified, internal node IDs will be included in exported Newick trees.
- display_mode
- Possible values: 1,2 or 3 (1=rectangular, 2=circular, 3=unrooted)
- tree_x
- Tree will be shifted horizontally by this value, positive or negative (value in pixels)
- tree_y
- Tree will be shifted vertically by this value, positive or negative (value in pixels)
- vertical_shift_factor
- Vertical tree scaling factor (positive number)
- horizontal_scale_factor
- Horizontal tree scaling factor (positive number)
- current_font_size
- Main label font size in pixels (integer)
- current_font_name
- Possible values: 'Arial', 'Courier', 'Courier New', 'Verdana', 'Impact', 'Georgia', 'Times New Roman' or 'Monotype Corsiva'
- current_font_style
- Possible values: 'normal', 'bold' or 'bold italic'
- leaf_sorting
- Possible values: 1 or 2 (1=normal sorting, 2=no sorting)
- label_display
- Possible values: 0 or 1 (0=hide labels, 1=show labels)
- align_labels
- Possible values: 0 or 1 (0=labels not aligned, 1=labels aligned)
- label_shift
- Amount to shift the leaf labels (positive or negative, in pixels)
- dashed_lines
- Display dashed lines connecting branches to leaf labels. Possible values: 0 or 1 (0=hide lines, 1=display lines)
- ignore_branch_length
- Possible values: 0 or 1
- slanted_normal
- Display tree in slanted (triangular) mode. Possible values: 0 or 1. If set to 1, note that both display_mode and ignore_branch_length must also be set to 1.
- arc
- Angle of the display arc for the circular tree (in degrees, a number between 0 and 360)
- rotation
- Rotation angle for circular tree (in degrees, a number between 0 and 360)
- normal_rotation
- Rotation angle for normal tree (in degrees, a number between 0 and 360)
- unrooted_rotation
- Rotation angle for unrooted tree (in degrees, a number between 0 and 360)
- line_width
- Width of tree lines (in pixels)
- line_gradient
- Is set to '1', branch color will be a gradient between ancestor and node color.
- default_branch_color
- Default color of tree's branches (hex, RGB or RGBA notation)
- default_label_color
- Default color of tree's labels (hex, RGB or RGBA notation)
- inverted
- Inverted display (only for circular and normal mode). Possible values: 0 or 1
- circle_size_inverted
- For inverted circular display only. Internal radius will be increased by this amount (value in pixels)
- range_mode
- Colored ranges display style. Possible values: 0,1 or 2 (0=off, 1=cover labels only, 2=cover full clades)<
- include_ranges_legend
- Include colored ranges legend. Possible values: 0 or 1
- ranges_legend_title
- Title of the colored ranges legend.
- internal_scale
- Draw internal tree scale. All internal scale settings below are only used if this is set to 1. Possible values: 0 or 1
- internal_scale_inverted
- Invert the internal tree scale (start at the farthest leaf instead of root). Possible values: 0 or 1
- internalScaleRootValue
- Set the time/number value for the tree root. All scale labels will be calculated from this number and the internalScaleTimeScaling value
- internalScaleTimeScaling
- Multiply all branch length values by this number when displaying scale labels.
- internalScaleAxis
- Draw internal tree scale axis. Possible values: 0 or 1
- internalScaleGrid
- Draw internal tree scale grid. Possible values: 0 or 1
- internalScaleFontSize
- Font size for internal scale labels (in px)
- internalScale1
- Repeat value for the first set of internal scale lines (branch length value)
- internalScale2
- Repeat value for the second set of internal scale lines (branch length value)
- internalScaleFixed
- Comma delimited list of fixed values (branch length) where lines should be drawn
- internalScale1Color
- Color for the first set of internal scale lines (hex, RGB or RGBA)
- internalScale2Color
- Color for the second set of internal scale lines (hex, RGB or RGBA)
- internalScaleFixedColor
- Color for the fixed position internal scale lines (hex, RGB or RGBA)
- internalScale1Label
- Draw labels on the first set of grid lines. Possible values: 0 or 1
- internalScale2Label
- Draw labels on the second set of grid lines. Possible values: 0 or 1
- internalScaleFixedLabel
- Draw labels on the fixed position grid lines. Possible values: 0 or 1
- internalScale1Dashed
- First set of grid lines will be dashed. Possible values: 0 or 1
- internalScale2Dashed
- Second set of grid lines will be dashed. Possible values: 0 or 1
- internalScaleFixedDashed
- Fixed position grid lines will be dashed. Possible values: 0 or 1
- internalScale1Wid
- Line width for the first set of internal scale lines (in px)
- internalScale2Wid
- Line width for the second set of internal scale lines (in px)
- internalScaleFixedWid
- Line width for the fixed position internal scale lines (in px)
- branchlength_display
- Display branch length text labels on branches (possible values: 0 or 1)
- branchlength_label_size
- Font size for the branch length labels (in pixels, integer >= 0)
- branchlength_label_position
- Position of the branch length labels along the branch (in percent, default is 50%)
- branchlength_label_sci
- Display branch length labels in scientific notation (if set to 1)
- branchlength_label_rounding
- Round branch length labels to this number of decimals (integer >= 0)
- branchlength_label_age
- Display node age instead of raw branch length values (if set to 1)
- metadata_source
- Which metadata source to use for bootstrap display options (default: 'bootstrap', other possible options depend on the data in the tree)
- bootstrap_display
- Display metadata values (possible values: 0 or 1)
- bootstrap_type
- Type of metadata display. Possible values: 1, 2, 3 or 4 (1=Symbol, 2=Text label, 3=Branch color and 4=Branch width
- bootstrap_symbol
- Symbol used to display metadata values. Possible values: 1, 2, 3 or 4 (1=Circle, 2=Triangle, 3=Square and 4=Star)
- bootstrap_symbol_min
- Minimum size for the metadata symbol (in pixels)
- bootstrap_symbol_max
- Maximum size for the metadata symbol (in pixels)
- bootstrap_symbol_position
- Position of the metadata symbol along the branch (in percent, default is 50%)
- bootstrap_symbol_color
- Bootstrap symbol color (hex, RGB or RGBA)
- bootstrap_slider_min
- Minimum metadata value to display
- bootstrap_slider_max
- Maximum metadata value to display
- bootstrap_label_position
- Position of the metadata text label along the branch (in percent, default is 50%)
- bootstrap_label_size
- Font size for the metadata text labels (in pixels, integer >= 9)
- bootstrap_label_sci
- Display metadata labels in scientific notation (if set to 1)
- bootstrap_label_rounding
- Round metadata labels to this number of decimals (integer >= 0)
- bootstrap_label_percent_factor
- All metadata text labels will be multiplied by this number
- bootstrap_width_default
- Branch width for nodes outside selected metadata range (in pixels), when bootstrap_type=4
- bootstrap_width_min
- Branch width for minimum metadata value (in pixels), when bootstrap_type=4
- bootstrap_width_max
- Branch width for maximum metadata value (in pixels), when bootstrap_type=4
- bootstrap_min_color
- Branch color for minimum metadata value (hex, RGB or RGBA), when bootstrap_type=3
- bootstrap_use_mid_color
- Use a three color gradient for metadata branch colors (possible values: 0 or 1)
- bootstrap_mid_color
- Branch color for midpoint metadata value (hex, RGB or RGBA), when bootstrap_type=3 and bootstrap_use_mid_color=1
- bootstrap_max_color
- Branch color for maximum metadata value (hex, RGB or RGBA), when bootstrap_type=3
- datasets_visible
- Comma delimited list of datasets to display (starting with 0, e.g. datasets_visible=0,2,5)
- delete_nodes_below_bootstrap
- delete all tree nodes with bootstraps lower than this value
External tools
A selection of iTOL related external tools / helper scripts:
- iTOL annotation editor: access your iTOL trees, create and edit datasets directly in Microsoft Excel, LibreOffice Calc or Google Sheets
- phyloT: an online tool which can generate trees based on NCBI taxonomy or the Genome Taxonomy Database and visualize them directly in iTOL or upload them to your iTOL account
- table2itol: an R script that makes it easy to generate iTOL annotations from spreadsheet files
- Gotree: GoTree is a set of command line tools to manipulate phylogenetic trees, implemented in Go language
- itolAPI: Phyton API for iTOL batch access
- itol.toolkit: Helper Functions for Interactive Tree Of Life (iTOL), R package
Please contact the authors of these tools directly if you encounter any issues.