It is with immense sadness that I share the news of the passing on 16 January 2026, of my colleague and friend Peer Bork.
Peer was a visionary, and his career was far too rich and intense to be summarized in just a few lines. His work on phylogenetics and the reconstruction of the Tree Of Life from fully sequenced genomes led to the initial idea and early development of iTOL. Without his leadership and support, it would never have grown into what it is.
You will be remembered forever.
Welcome to iTOL v7
Interactive Tree Of Life is an online tool for the display, annotation and management of phylogenetic and other trees.
Manage and visualize your trees directly in the browser, and annotate them with various datasets.
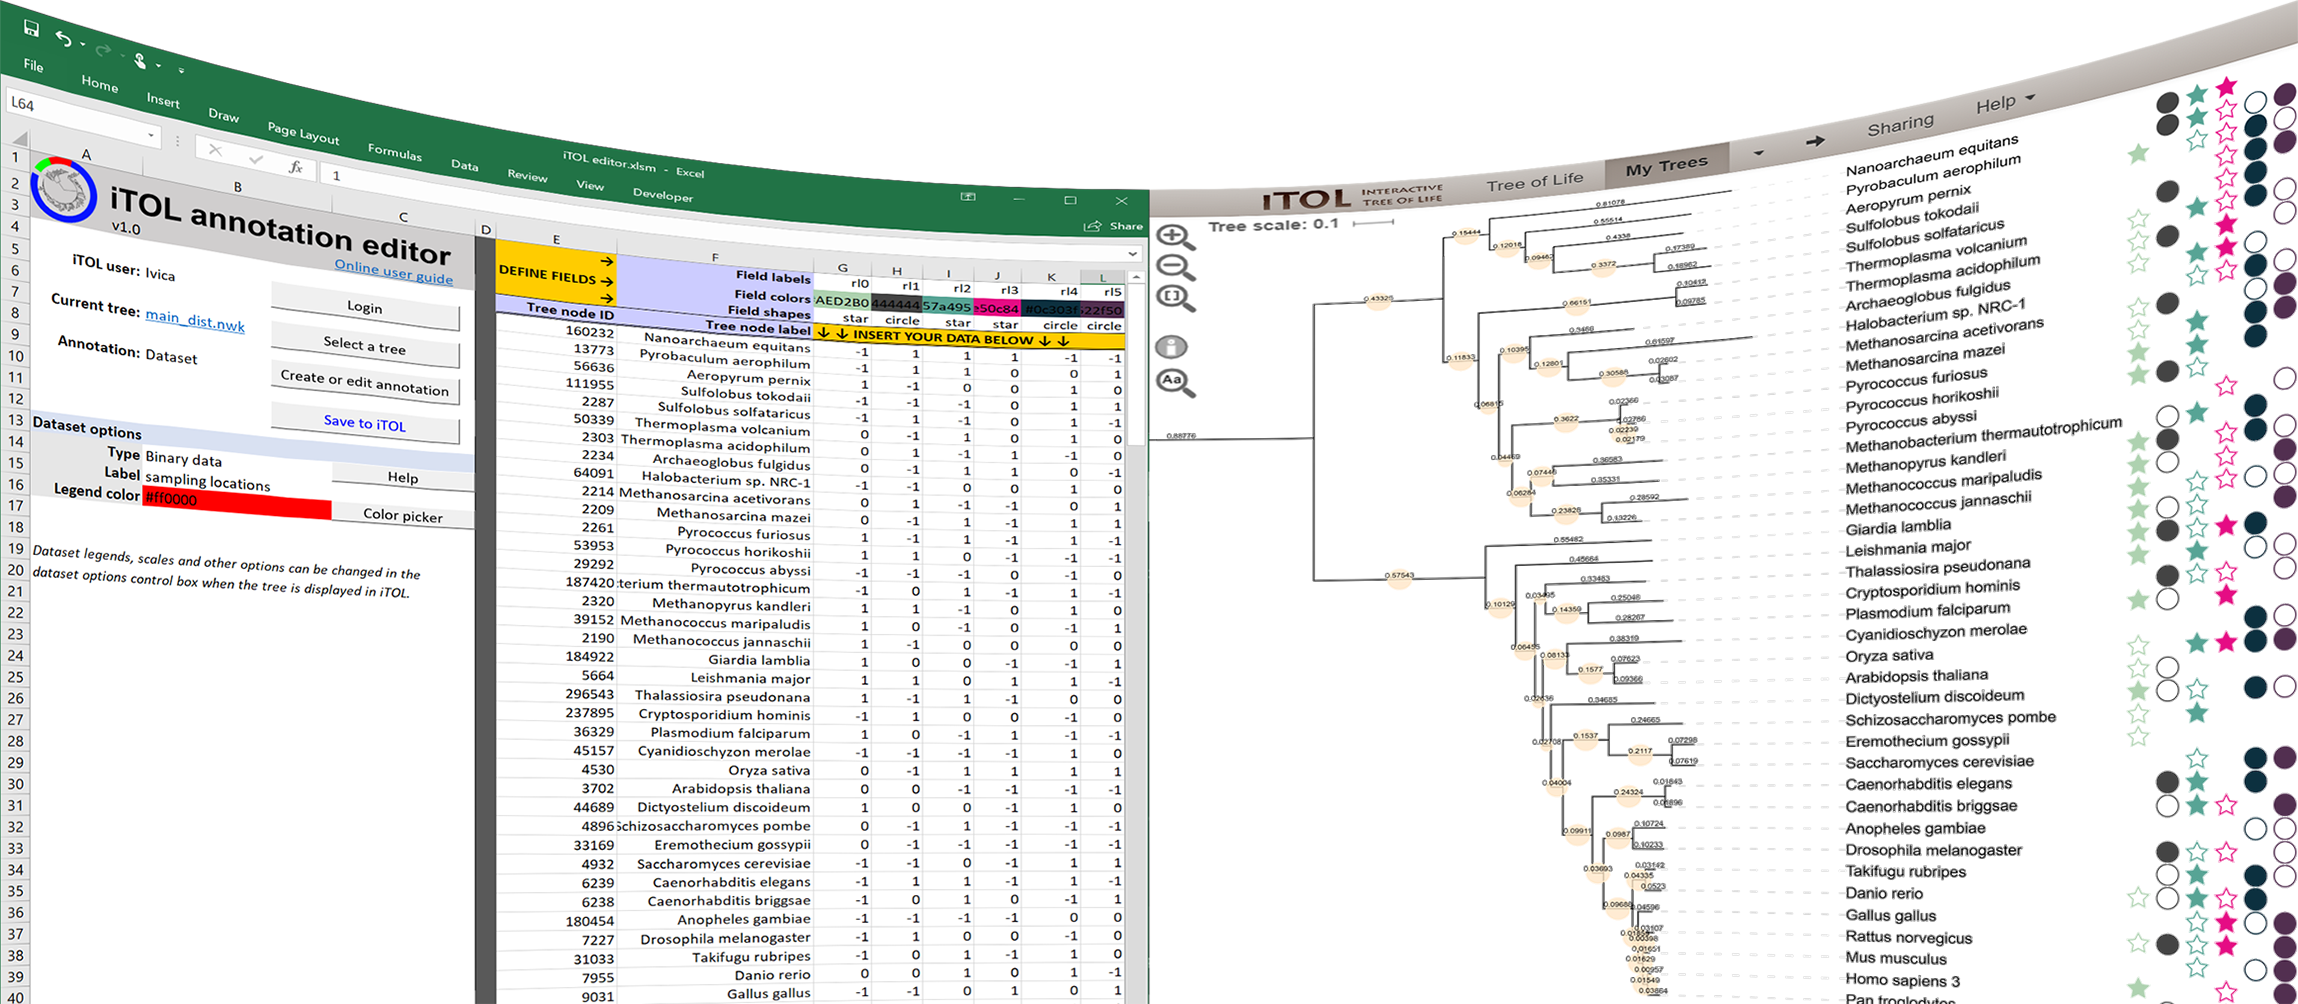
Tree annotation made easy.
Annotate your trees directly from Microsoft Excel, LibreOffice or Google Sheets, or use the integrated web dataset editor. Advanced users can create the dataset template files and drag/drop them directly onto the tree, with complete control of all visualization options.
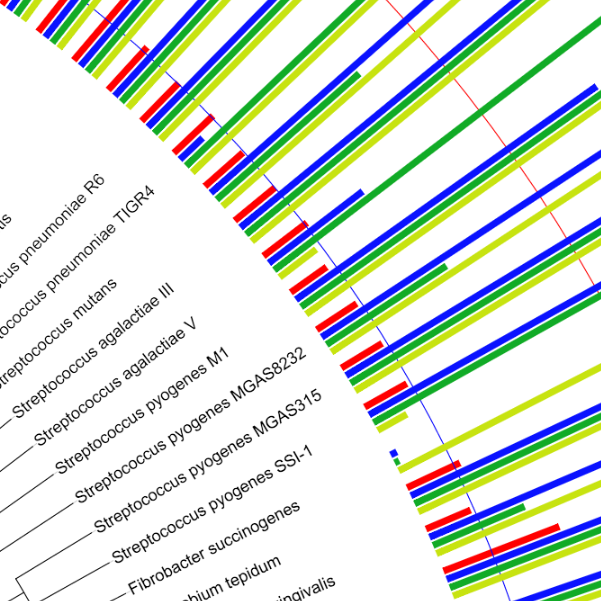
Adjust branch and label colors, styles and fonts interactively or by using annotation template files.
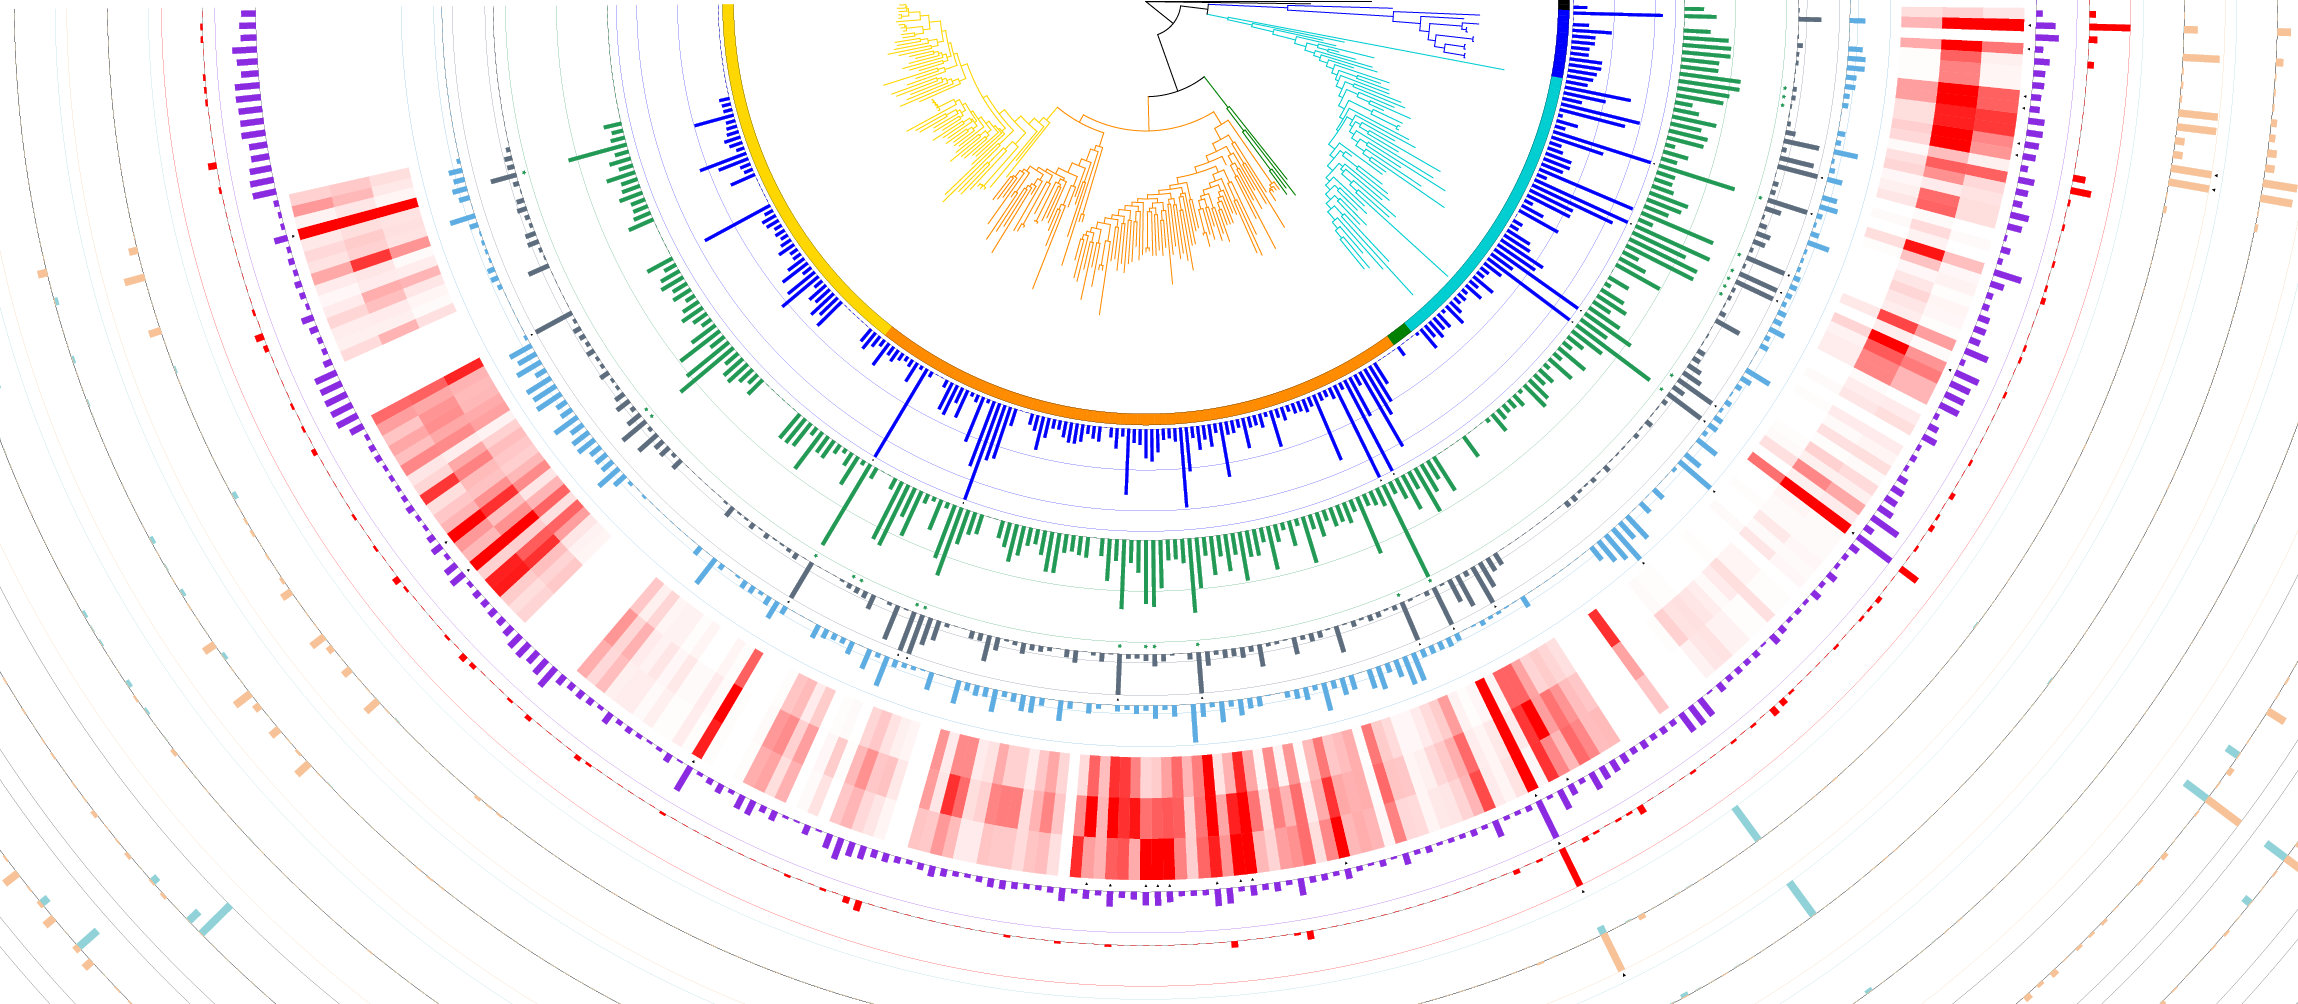
Unlimited number of datasets.
All datasets can be simultaneously displayed, with fine-grained interactive control of their position, size and other visualization parameters.
Create publication quality figures.
iTOL provides What-You-See-Is-What-You-Get high quality export into several vector and bitmap graphics formats. Interactively adjust all tree and dataset visualization options as you like, and the exported figure will exactly mirror your screen.
Note: See the details on iTOL access modes and subscriptions
Current changelog: version 7.4.2
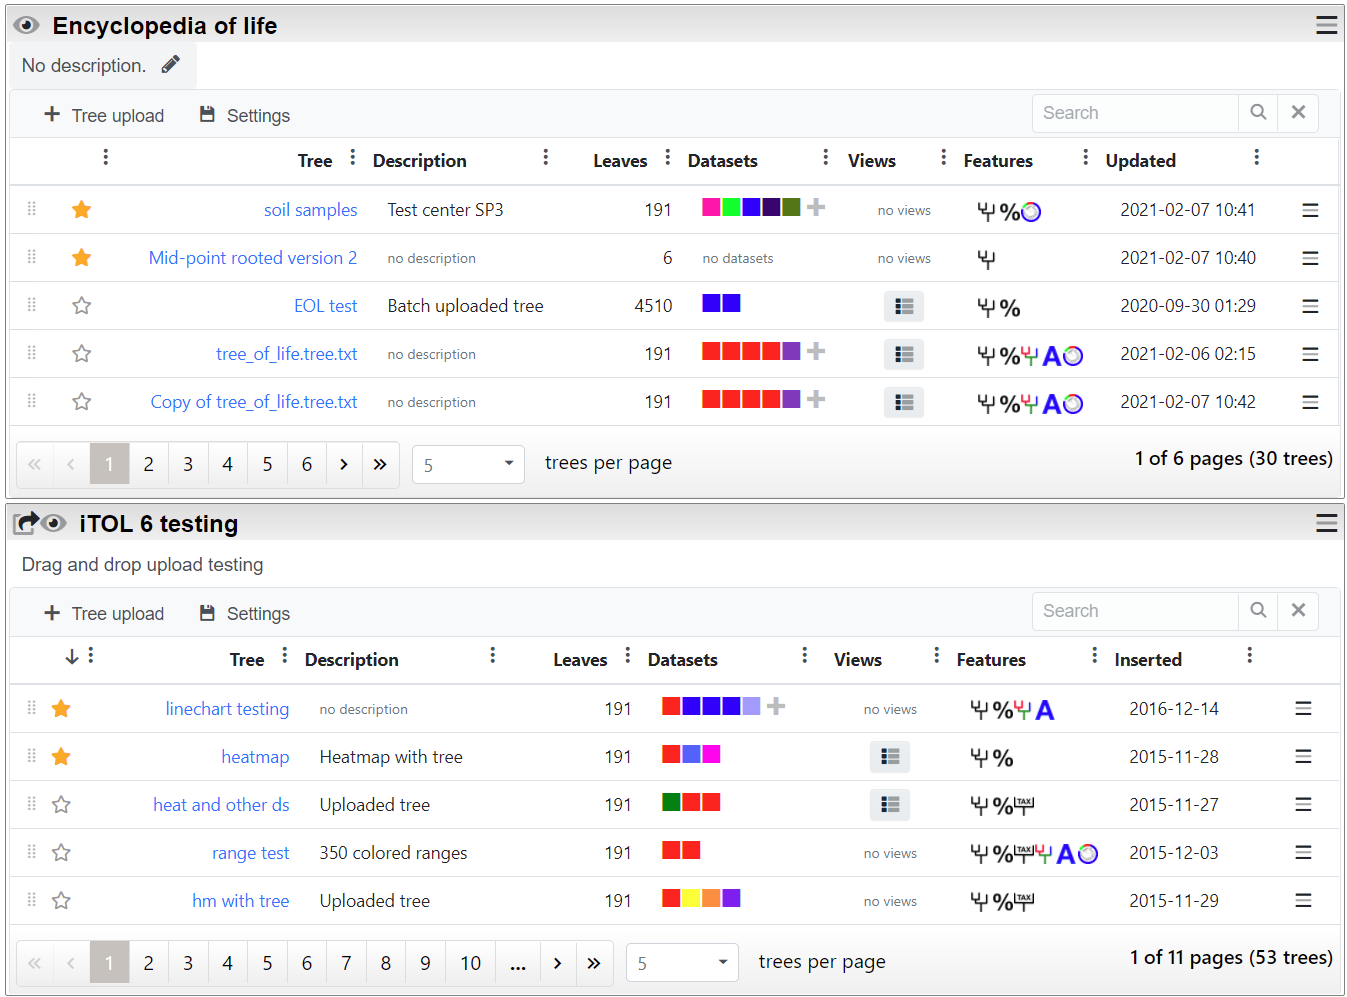
Manage
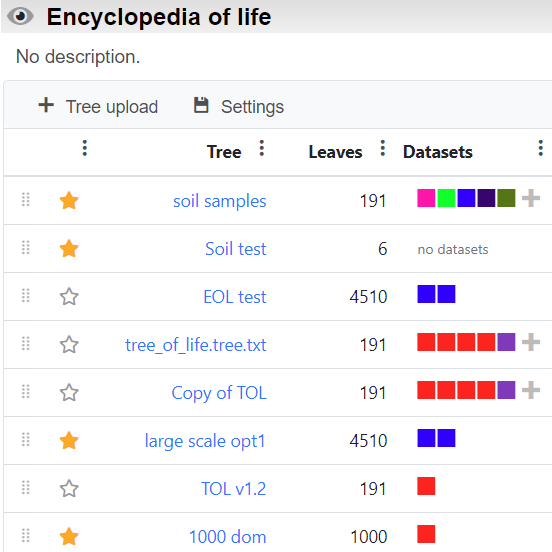
Organize your trees into workspaces and projects, and access them from any browser. Simply drag and drop multiple tree files onto a project to upload them all at once.
Annotate
19 dataset types. Full control over branch colors, widths and styles. Individually adjustable label fonts, sizes and styles. Check our gallery of user created trees.
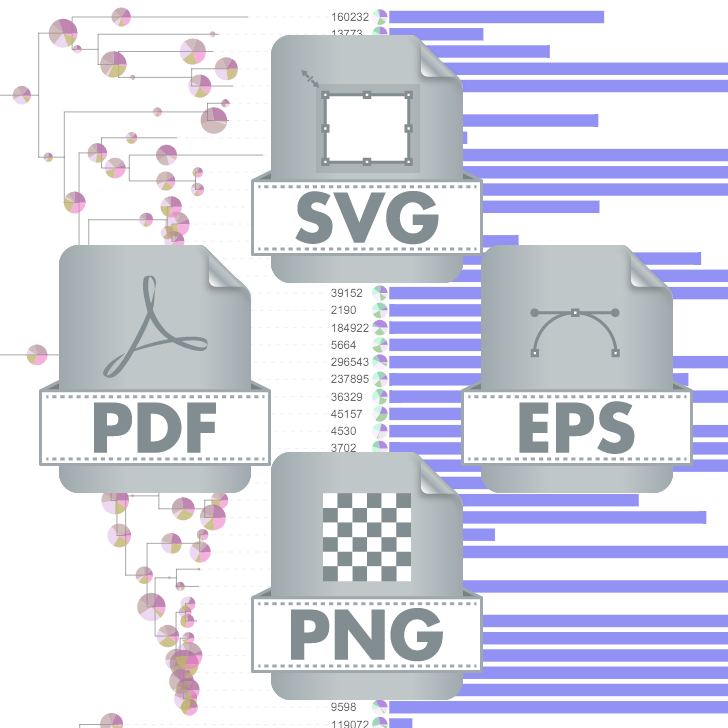
Export
Create high quality tree figures for your publications. Direct What-You-See-Is-What-You-Get export of what is displayed on the screen. Export into various vector or bitmap formats.
Various display modes. Support for large trees.
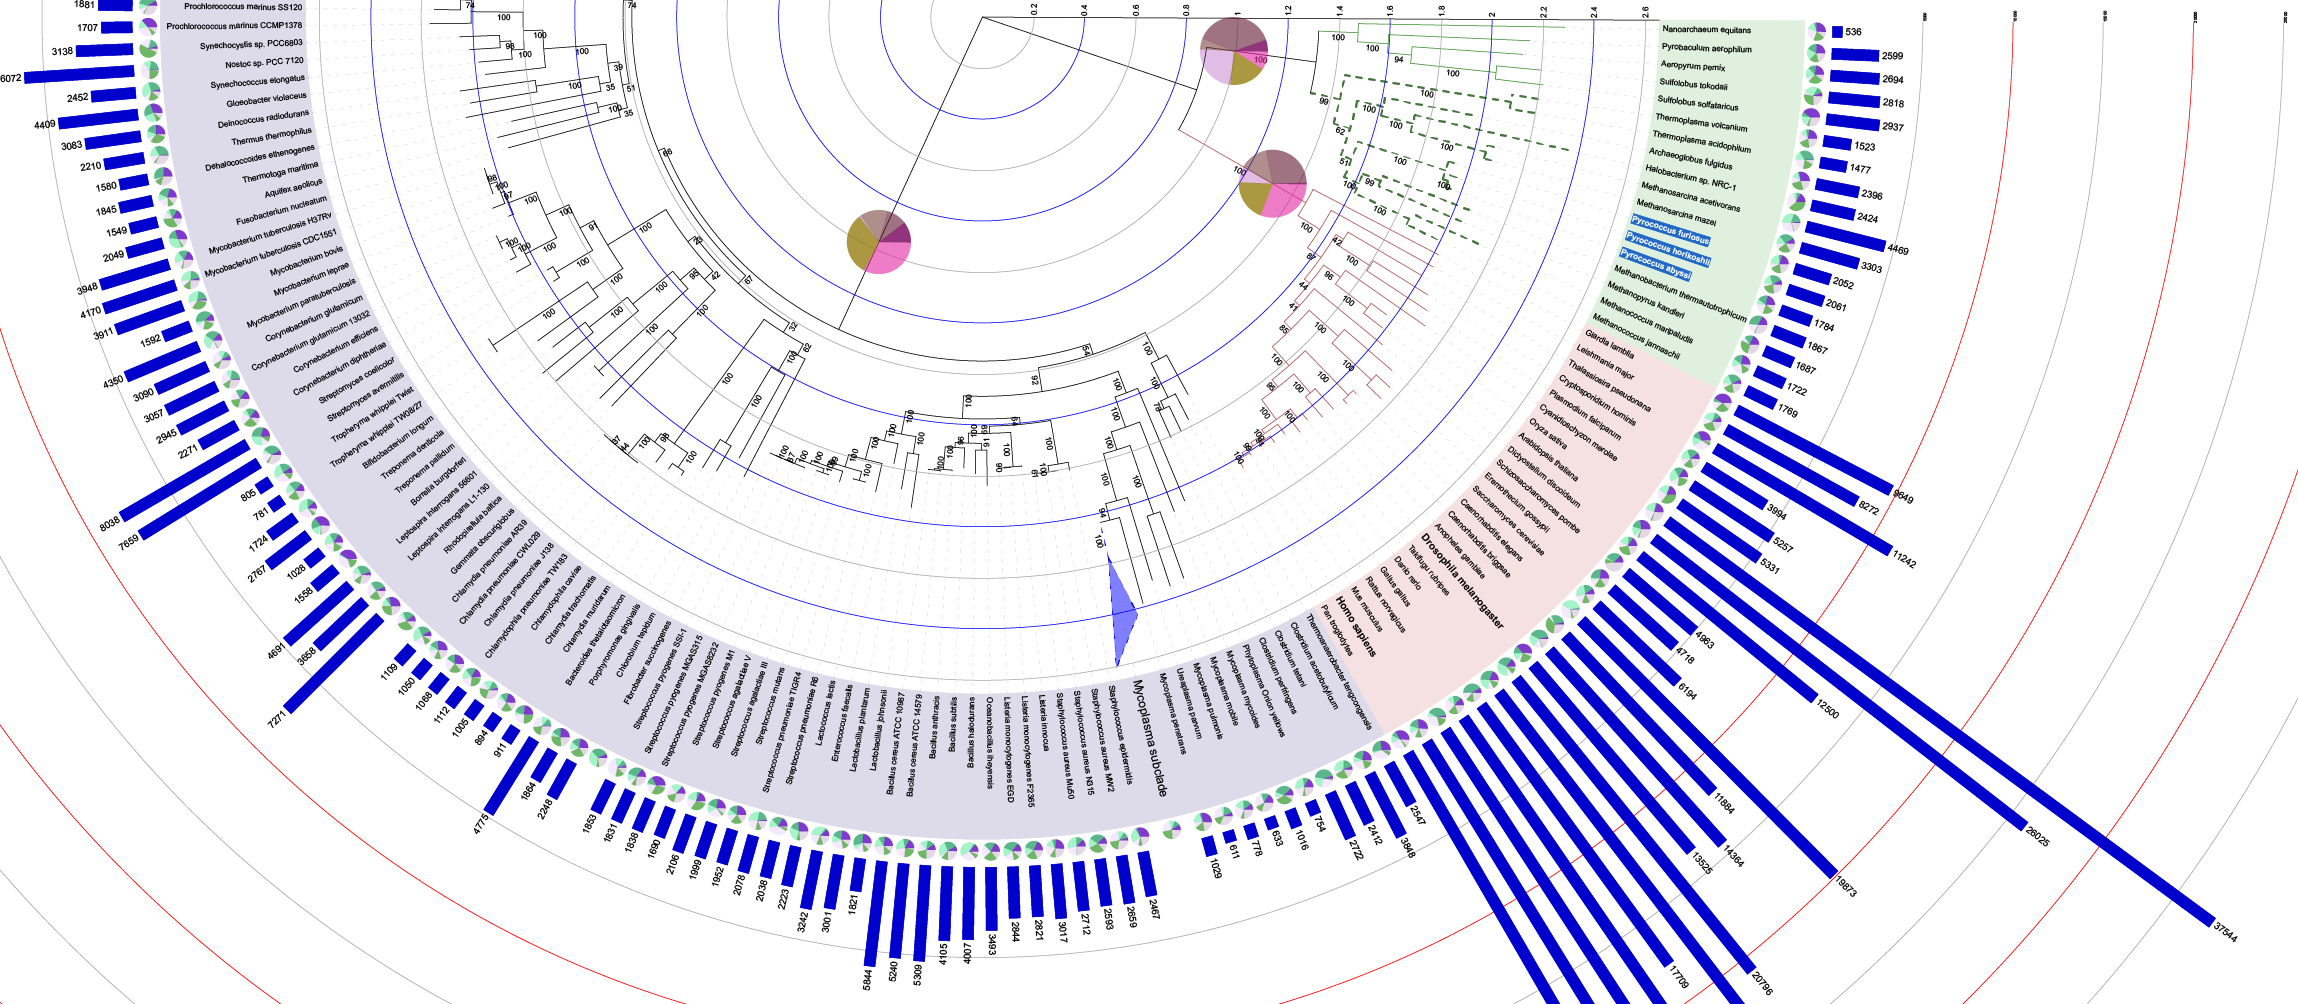
iTOL can visualize trees with 50'000 or more leaves. With advanced search capabilities and display of unrooted, circular and regular cladograms or phylograms, exploring and navigating trees of any size is simple.
Upload a tree Create an account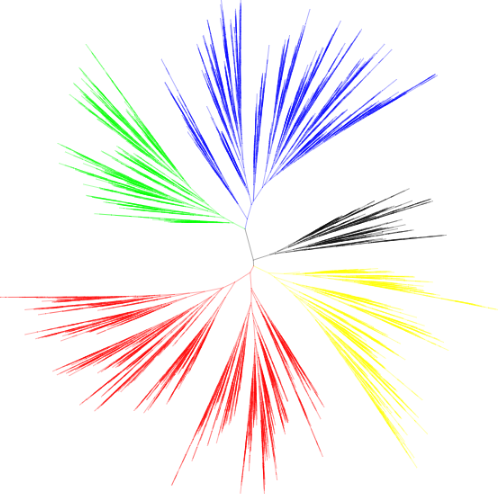
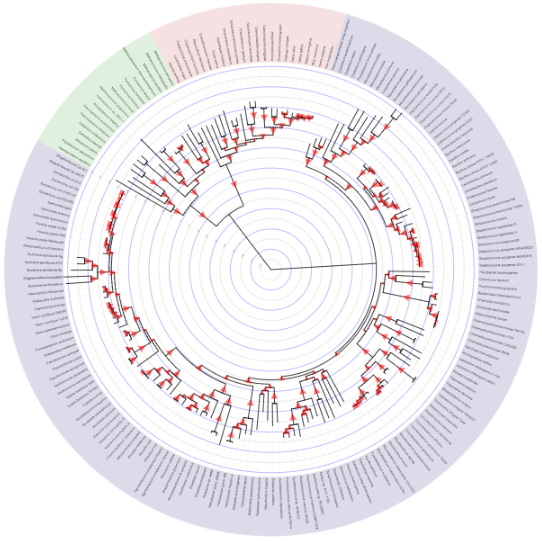
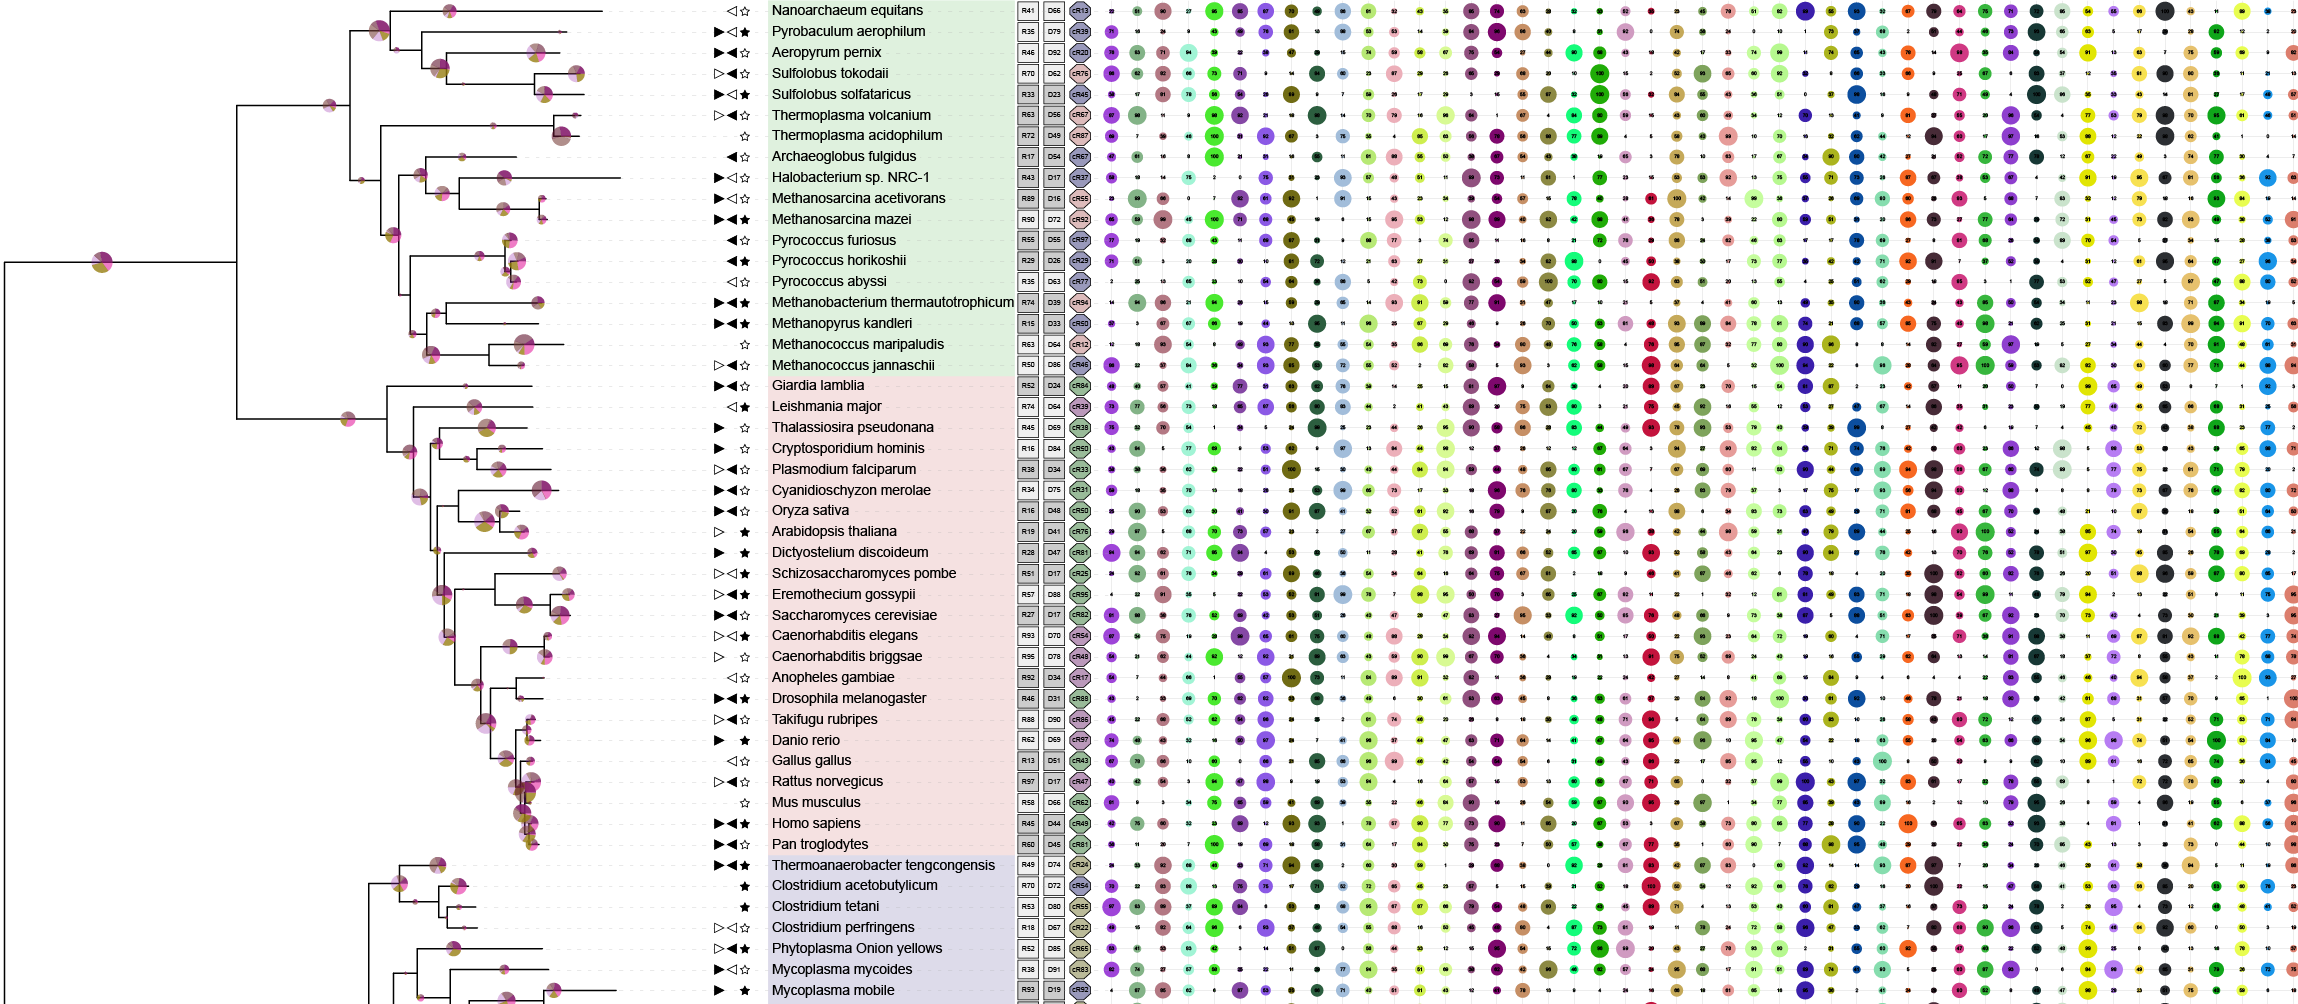
Visualize support values. Explore clade distances.
Branch support values and other metadata can be visualized as various shapes with adjustable colors and sizes or as text labels. Alternatively, branch colors or widths can be linked to the underlying data values.
Trees with branch length information can have an internal scale with adjustable levels and colors, allowing easy estimation of distances between various clades.
Upload a tree Create an accountSimple management of all your trees. Share your work.
Create unlimited workspaces and projects, and organize your trees using simple drag and drop. Customize the project displays individually or across your whole account.
Projects can be shared easily, providing public or private access to your trees.